


Google translation + light editing from the Swedish site Stockholm's Initiative:
The informational bomb curve
Here is a guest post by biochemistry Professor Dr. Gösta Pettersson with new results that provide answers to criticism performed in a couple of blog posts by Professor Mats Almgren. Gösta Pettersson shows that his simple temperature-dependent box model can explain both the bomb curve and the Keeling Curve including El Niño fluctuations. In addition to the weaknesses of Mats Almgren criticism Gösta Pettersson takes up here, I brought up other weaknesses in an earlier blog post .
The informational bomb curve
Gösta Pettersson
The above-ground nuclear weapons tests during the Cold War are approximately doubled atmospheric levels of C14 emissions. After the 1963 test ban treaty, most of this excess of 14C-carbon dioxide removed from the atmosphere. That this is the case has been coated by measurements of the so-called ΔC14 values, whose temporal changes constitute what I described as bomb test curve.
Professor Mats Almgren has indicated that ΔC14 at current definition is not proportional to changes in the amount of C14, but related to the latter ( n14 ) according to the relationship
n14/n14s = (ΔC14 +1) n12/n12s Eqn. (1)
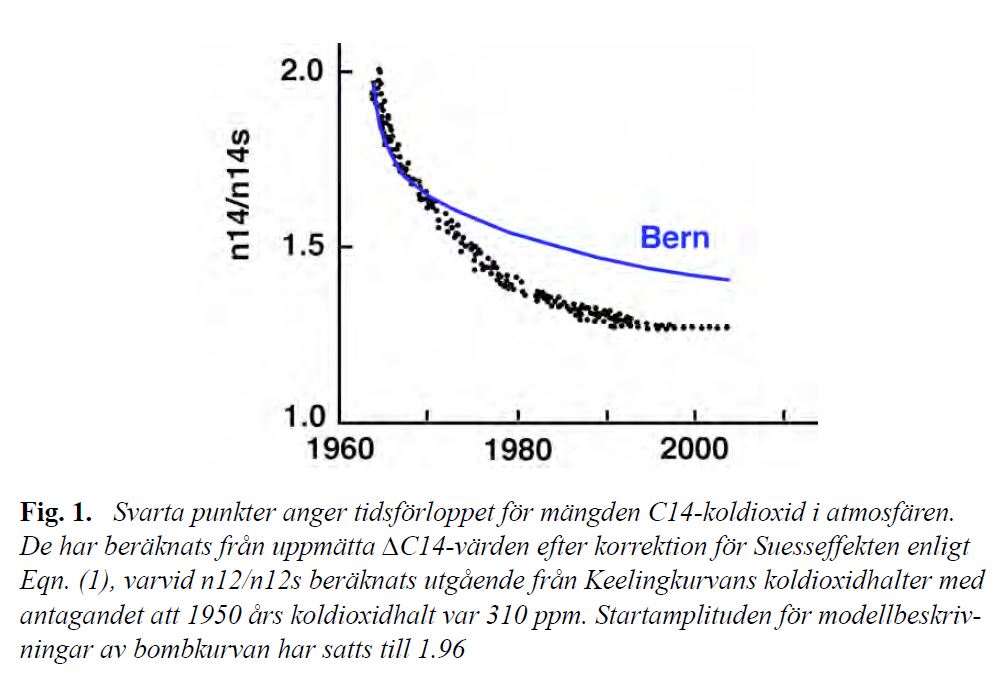
where n12 represents the amount of C12 and the index s indicates the values of the variables in a standard year (1950) prior to nuclear tests. In my last guest post corrected and I packed me for Almgren's instructions and featured a character with an accurate translation of ΔC14 to n14 . It is reproduced in slightly modified form in Figure 1 below, which shows how the amount of C14 in the atmosphere declined after September 1963, ΔC14 values measured at the North Cape and in Central Europe. I embrace the Almgren and others abbreviation of "bomb test curve" to "bomb curve", but let those words stand for black data in Fig.1, the ones that show how the amount of airborne C14-carbon dioxide dropped after the CTBT.
Following the agreement reached concerning the translation of ΔC14 to n14 has Almgren gave his views on what the bomb curve says about the carbon cycle. He argues that it requires very specific conditions to the disappearance of a pulse of carbon dioxide shall comply the bomb curve course, there were plenty of C14 in the system even before the bomb tests, there is evidence that air is added to the C14, both before and after the bomb tests, and to Such C14-supply suggested to be due to isotope effects in carbon dioxide exchange.
These circumstances lead to the conclusion Almgren to bomb curve is not at all reflect the disappearance of a pulse of carbon dioxide and therefore can not be used for falsification of eg. [the IPCC's] Bern model. I want to designate as a completely wrong conclusion . Almgrens words "not at all reflect" probably has a different meaning than what I deduce from them and is a trifle in the context. But just in case it should be noted that the bomb curve is obviously highly influenced by (and in this sense reflects) the disappearance of the excess pulse of 14C-carbon dioxide bomb tests gave rise to. Since the C14 carbon is carbon dioxide gives bomb curve thus information about the disappearance of a pulse of carbon dioxide. This information can obviously be used to test the validity of the presented CO2 model.
The Bern model has been constructed and calibrated based on the premise that only anthropogenic emissions contributed to increasing atmospheric carbon dioxide concentration under Keeling Curve. Blue curve in Figure 1 shows the graph of the model's "impulse response function", ie. the relaxation function that specifies under which the time course a pulse rate of carbon dioxide excess on the model is removed from the atmosphere. The model considers all carbon isotopes as kinetically identical, why blue curve also indicates the model regulations relating to the relaxation process of an excess pulse of C14 emissions.
Therefore, the results in Figure 1 are clearly evidence that the Bern model is falsified by the bomb curve . The 1963 surplus of C14 CO2 disappeared significantly faster than the Bern model prescribes. None of the of Almgren foregoing circumstances may change the situation. Have the air added to the C14 after the bomb test pulse, so this addition is included in the bomb curve and not the later one iota closer to the blue model curve in Figure 1. Conversely, the discrepancy between the blue curve and the part of the bomb curve corresponding to the relaxation of bomb test pulse. Furthermore, the experimental ΔC14 values measured with high accuracy and corrected for Suess effect on the basis of well known data for n12/n12s-kvoten. This means that the discrepancy between the observations and blue curve in Figure 1 is not significant and represents any random variation.
Because the excess of C14-carbon disappeared as quickly as bomb curve shows can also be concluded that anthropogenic emissions can not be the only noteworthy reason that atmospheric carbon dioxide levels have increased (it would require that the relaxation process is so slow that Bern model prescribes). The basic premise of the Bern model's construction is destroyed then the bomb curve. The designers failed to take into account all factors of significance for carbon dioxide exchange. Moreover, it has been over-emphasized factors that appear to be of minor importance; bomb curve shows no tendency to the marked flerfasighet characterizing Bern model blue curve and Almgren ascribe the transition from rapid exchange with surface water to slower exchange with the deep ocean.
Is there any better explanation for bomb curve appearance? My answer is yes, based on analyzes of the same basic concept as the 1950s climatological pioneers started from when the shortage of computers did not have the opportunity to review details but focused on the main features: The kinetics of atmospheric excess CO2 elimination must be mainly determined by the exchange with the hydrosphere which constitute the dominant sink. In Paper 3 , I have shown that a simple air / ocean model adequately describes both Keeling curve term trend as the temperature dependence of the El Niño fluctuations. Red curve in Figure 2 shows what this simple model (hereafter referred to as "my model") prescribes concerning relaxation of bomb tests excess of atmospheric C14 emissions.
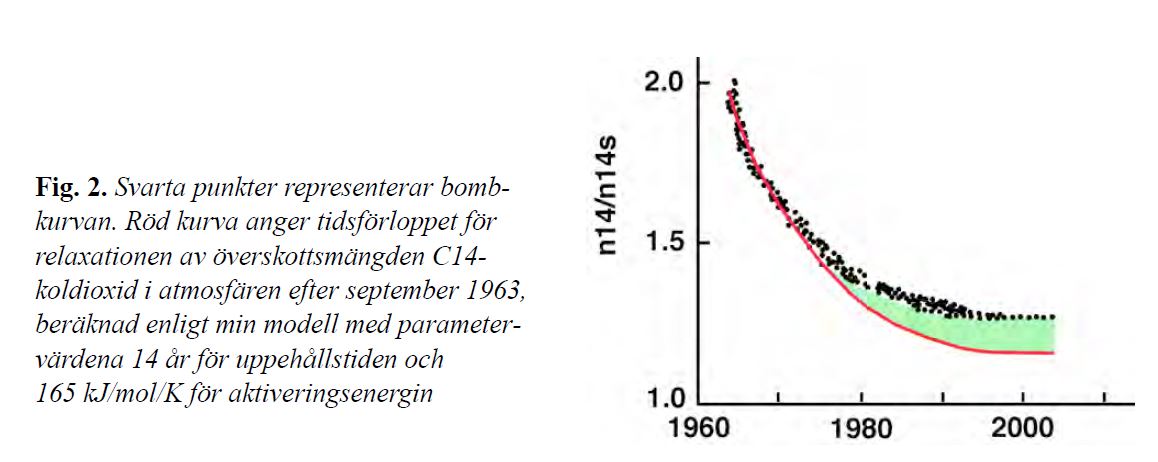
My model provides an acceptable description of the elimination of the first half of the 1963 surplus of C14, but stipulates that the amount of C14 in 2004 should have ended 16% higher than the 1950 year standard value rather than the 27% higher as bomb curve indicates. Either model shows about 10% error at the end of the curve, or the amount of C14 in the atmosphere increased about 10% by supplements that are not directly related to the bomb test pulse.
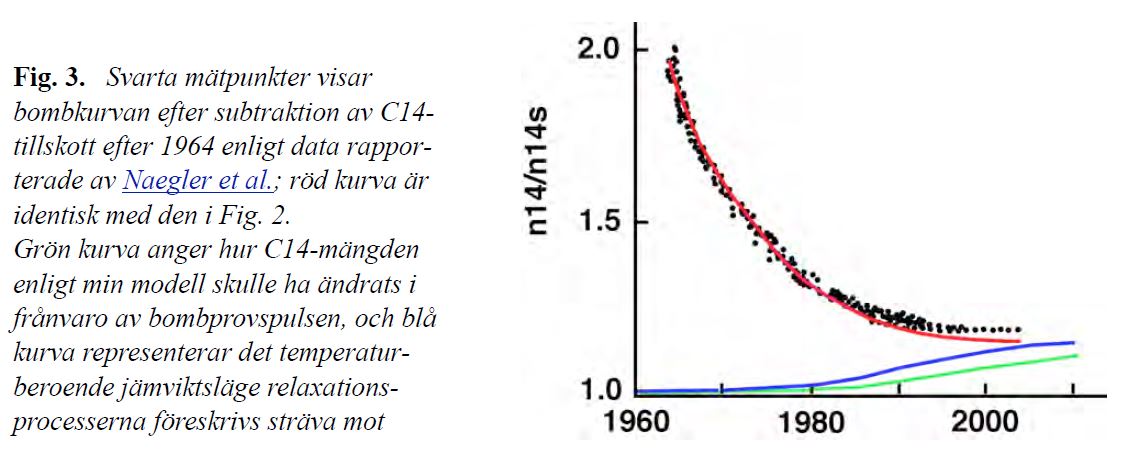
Crucial support for the latter option gives the inventory of bomb-C14 as kolcykelforskare at Heidelberg University conducted on the basis of the large number of ΔC14-series using an advanced model that includes the biosphere and divide the atmosphere into 22 zones ( Naegler et al. ) . was found among other things that the amount of C14 in the air during the period 1964-2005 at length increased by 8% of the total amount bomb tests prior to complete.This was explained as an effect of industrial emissions of C14 (and should also include any C14 contribution from nuclear weapons testing by Test Ban Treaty).
Same industrial C14 supplements must then be assumed to contribute to bomb the curve, ie.should be subtracted from bombkurvans readings to give a picture of how the relaxation of the actual bomb test pulse progressed. Figure 3 shows that such correction of the bomb curve virtually eliminate the previous discrepancy (highlighted green zone in Figure 2) against my model.Remaining differences are so small that they should fall within the limits of error for the data measurement points and model calculations are based on.
Of Naegler et al.'s Results also show that the hydrosphere and biosphere in 2005 together made up 84% of the 1964 surplus of atmospheric C14. This means that the relaxation of the excess proceeded at such a pace that only 16% of it may have been left in the air in 2005. Measured on the uptake of C14-surplus thus has this disappeared from the air in excellent conformity with the final value 1.16 for the red curve in Figure 2-3.
The gist of all this is that bomb curve gives fully reliable and extractable information about the disposal of the atmospheric C14 surplus bomb tests gave rise to. My model provides a good description of the relaxation process, and is consistent with what Heidelbergforskarna concluded with far more advanced models, and based on a far more extensive observational material. In both cases, the analyses clearly show that 80% of the bomb test pulse transmitted from the air to the outdoors in general within less than 30 years, in stark contrast to the IPCC's assertion that it takes several centuries to dispose of 80% of the excess pulse of atmospheric carbon dioxide. Whether bomb curve or Heidelbergforskarnas C14 inventories in 2006 [ Naegler et al. ] or 2010 [Levin et al. ] not support the Bern model's instruction to approximately 40% of the bomb test pulse is still present in the air.
The corrected bomb curve in Figure 3 is monophasic, although not strictly exponential. It is described so well by my model that I certainly can stand by my previous conclusion that the removal of atmospheric carbon dioxide excess is overwhelmingly controlled by the air's carbon dioxide content in accordance with the law of mass action (the basis for the model's kinetic differential equations) and the residence time of 14 years. There is absolutely no indication that the slow processes in the oceans have a significant effect on the relaxation process, in any case, no effects of the kind the IPCC Bern model prescribes.
Will this that my model provides a simple explanation for the amount of airborne C14-carbon dioxide rose slightly even before the nuclear test. The period 1850-1950 was characterized by global warming, and heating provides thermal degassing. If one assumes the IPCC's assumption that the carbon cycle was in equilibrium in pre-industrial times (before 1850), so provide my model that the amount of C14 in the air then it should have been 5% lower than the standard year 1950.Because global warming has progressed in the second half of the 1900s, one can expect that the amount of C14 in the air would have continued to increase, although there have been no nuclear weapons tests. Green curve in Figure 3 shows how the increase would have looked like in my model.
So the rising C14 amounts before the bomb tests are best explained as a temperature effect of equilibrium positions, the same effect as under Paper 3 contributed to about half of the observed increase in atmospheric total carbon dioxide levels during the industrial period. That bomb curve for such reasons, in my model should tend towards n14/n14s-värden significantly higher than 1 has been pointed out by Pehr Björnbom with multiple and illuminated by the red curve in Figure 3.
Blue curve in Figure 3 indicates my model regulation on how the equilibrium position of the air C14 amount varied after 1960, ie. shows the temperature dependence of the final value that relaxation of C14-surplus pursued. Bomb The curve was in 2004 very close to this year's equilibrium value.My previous conclusion that the bomb curve gives an observed image of more than 95% of the relaxation process is itself therefore remains. To the extent that the elimination of atmospheric carbon dioxide excess is controlled by the process with relaxation times on the order of hundreds or thousands of years, then such slow processes only expected to affect the removal of the last few percent of example. emissions of fossil carbon dioxide.
Almgren has termed bomb curve as a lingering myth . I hope the bomb curve remains tenacious in debate, for it is definitely not a myth. Instead, it represents one of several basic observations provide evidence that the Bern model is inconsistent with the present experimental results concerning the disposal of excess atmospheric carbon dioxide. This has been pointed out by many authors before me and is fully in line with the position taken NIPCC.
The IPCC continues to cling to his preconceived notions that anthropogenic emissions of fossil carbon dioxide is the dominant cause of the atmospheric carbon dioxide concentration increase. Therefore, one is forced to continue to ignore the bomb curve and many studies showing that carbon dioxide retention is in the order of 10 years rather than 100 years, evidence unchanged from the strong temperature effects on the Keeling curve produced by El Niño fluctuations. This ignorance (which leads to neglect of thermal degassing) is, according to the argument in Paper 3 reason why the IPCC arrives at a CO2 budget where about one third of the anthropogenic carbon emissions disappeared without a trace to an unidentified "missing sink"; they renamed it to "residual terrestrial sink".
My model does not ignore the above-mentioned observations, but relies on them and explains them with strict kinetic link that leads to a balanced CO2 budget. The bomb curve still represents one of the strongest evidence that the IPCC provides a grossly exaggerated picture of how long the anthropogenic carbon dioxide emissions will remain in the air. Many of the arguments I stated in my earliest posts were misguided because they were related to an incorrect translation of ΔC14values. Yet had the fundamental conclusions I then drew much stronger support of the experimental data than the kolcykelbild IPCC paints. After the correct translation of the C14 values according to Almgren's instructions conclusions can now be drawn on the basis of entirely sound data and arguments.


0 comments:
Post a Comment