Express Global

  • Subscribe to our RSS feed.
  • Twitter
  • StumbleUpon
  • Reddit
  • Facebook
  • Digg

Monday, 4 November 2013

New paper finds the Sun controls European & North Atlantic weather via ocean oscillations

Posted on 23:31 by Unknown
A paper published today in the Journal of Geophysical Research Atmospheres finds changes in solar activity over the 11-year solar cycle had a significant, lagged effect on North Atlantic & European weather patterns over the 140 year period from 1870-2010. According to the authors, "The analysis reveals a statistically significant 11-year solar signal over Europe and the North Atlantic provided the data are lagged by a few years. The delayed signal resembles the positive phase of the North Atlantic Oscillation (NAO) following a solar maximum. The corresponding sea surface temperature response is consistent with this." 


The paper suggests a solar amplification mechanism by which tiny 0.1% changes in solar irradiance during solar cycles have a lagged effect on the natural North Atlantic Oscillation (NAO), which in turn has large effects upon North Atlantic & European weather patterns. The paper adds to many other peer-reviewed publications finding solar amplification mechanisms including ocean oscillations such as ENSO and the NAO, atmospheric oscillations such as the Madden-Julian Oscillation, Quasi-biennial Oscillation, Aleutian Low, Eurasian pattern, & Asian monsoon, and via stratospheric ozone, and sunshine hours/clouds.


A Lagged Response to the 11-year Solar Cycle in Observed Winter Atlantic/European Weather Patterns

Lesley J. Gray, Adam A. Scaife, Daniel M. Mitchell, Scott Osprey, Sarah Ineson, Steven Hardiman, Neal Butchart, Jeff Knight, Rowan Sutton, Kunihiko Kodera

DOI: 10.1002/2013JD020062

The surface response to 11-year solar cycle variations is investigated by analysing the long-term mean sea level pressure and sea surface temperature observations for the period 1870–2010. The analysis reveals a statistically significant 11-year solar signal over Europe and the North Atlantic provided the data are lagged by a few years. The delayed signal resembles the positive phase of the North Atlantic Oscillation (NAO) following a solar maximum. The corresponding sea surface temperature response is consistent with this. A similar analysis is performed on long-term climate simulations from a coupled ocean–atmosphere version of the Hadley Centre model that has an extended upper lid so that influences of solar variability via the stratosphere are well resolved. The model reproduces the positive NAO signal over the Atlantic / European sector but the lag of the surface response is not well reproduced. Possible mechanisms for the lagged nature of the observed response are discussed.


Read More
Posted in | No comments

Does Environmentalism Cause Amnesia? Alarmism of famine recycled again & again

Posted on 18:33 by Unknown
Does Environmentalism Cause Amnesia?


Climate-change alarmists warn us about coming food shortages. They said the same in 1968.


By BRET STEPHENS


WSJ.COM 11/4/13: Warming is becoming a major problem. "A change in our climate," writes one deservedly famous American naturalist, "is taking place very sensibly." Snowfall, he notes, has become "less frequent and less deep." Rivers that once "seldom failed to freeze over in the course of the winter, scarcely ever do so now."


And it's having an especially worrisome effect on the food supply: "This change has produced an unfortunate fluctuation between heat and cold, in the spring of the year, which is very fatal to fruits."


That isn't a leaked excerpt from the latest report of the U.N.'s Intergovernmental Panel on Climate Change, but it may as well be. Last week, Canadian journalist Donna Laframboise of the website No Frakking Consensus posted a draft of a forthcoming IPCC report on the alleged effects climate change will have on food production. The New York Times then splashed the news on its front page Saturday. It's another tale of warming woe:


"With or without adaptation," the report warns, "climate change will reduce median yields by 0 to 2% per decade for the rest of the century, as compared to a baseline without climate change. These projected impacts will occur in the context of rising crop demand, projected to increase by 14% per decade until 2050."


Two silly books, now being recycled by global warming alarmists.


If this has a familiar ring, it's because it harks back to the neo-Malthusian forecasts of the 1960s and '70s, when we were supposed to believe that population growth would outstrip food production. This gave us such titles as "Famine 1975!", a 1967 best seller by the brothers William and Paul Paddock, along with Paul Ehrlich's vastly influential "The Population Bomb," a book that began with the words, "The battle to feed all of humanity is over. In the 1970s and 1980s hundreds of millions of people will starve to death in spite of any crash programs embarked upon now."


In case you're wondering what happened with that battle to feed humanity, the U.N.'s Food and Agriculture Organization has some useful figures on its website. In 1968, the year Mr. Ehrlich's book first appeared, Asia produced 46,321,114 tons of maize and 439,579,934 of cereals. By 2011, the respective figures had risen to 270,316,205, up 484%, and 1,289,633,254, up 193%.


It's the same story nearly everywhere else one looks. In Africa, maize production was up 247% between 1968 and 2011, while production of so-called primary vegetables has risen 319%; in South America, it's 308% and 199%. Meanwhile, the world's population rose to just under seven billion from about 3.7 billion, an increase of about 90%. It is predicted to rise by another 33% by 2050.


But what about the supposedly warming climate? According to the EPA, "average temperatures have risen more quickly since the late 1970s," with the contiguous 48 states warming "faster than the global rate." Yet U.S. food production over the same time has also risen by robust percentages even as the number of acres under cultivation has been steadily falling for decades.


In other words, even if you believe the temperature records, a warming climate seems to correlate positively with greater food production. This has mainly to do with better farming practices and the widespread introduction of genetically modified (GMO) crops, and perhaps also the stimulative effects that carbon dioxide has on photosynthesis (though this is debated). Warming also could mean that northern latitudes now not suited for farming might become so in the future.


But whatever the reason, the world isn't likely to be getting any hungrier. Quite the opposite: Purely natural (as opposed to man-made) famines are becoming unknown. As the Irish economist Cormac Ó Gráda noted in a 2010 paper, "in global terms, the margin over subsistence is now much wider than it was a generation ago. This also holds for former famine zones such as India and Bangladesh, whereas China, once the 'land of famine,' nowadays faces a growing problem of childhood obesity." Only in Africa is food scarcity still an issue, but even there recent food crises in Malawi and Niger did not result in major loss of life.


What does hurt people is bad public policy. Exhibit A is the U.S. ethanol mandate—justified in part as a response to global warming—which diverted the corn crop to fuel production and sent global food prices soaring in 2008. Exhibit B is the cult of organic farming and knee-jerk opposition to GMOs, which risk depriving farmers in poor countries of high-yield, nutrient-rich crops. Exhibit C was the effort to ban DDT without adequate substitutes to stop the spread of malaria, which kills nearly 900,000 people, mostly children, in sub-Saharan Africa alone with each passing year. The list goes on and on.


Environmentalists tend to have conveniently short memories, especially when it comes to their own mistakes. They would do better to learn from history. Just take the quote about the warming climate with which this column began. It's from "Notes on the State of Virginia" by Thomas Jefferson, published in 1785.


Read More
Posted in | No comments

Analysis shows accumulated solar energy explains 20th century global warming; no significant effect of CO2

Posted on 15:26 by Unknown
Conservation of Energy & Sunspot Number Time-Integral

Guest post by Dan Pangburn


Conservation of Energy


Earth is in the vacuum of space so the only way that the planet can gain or lose energy (excluding nuclear processes) is by electromagnetic radiation. The energy equation applied to the planet is:


Energy IN minus energy OUT = CHANGE in energy stored.


Over centuries, the average global temperature trend doesn’t change much. This means there must be a breakeven for energy IN and energy OUT. During a shorter period, changes to average global temperature are brought about by deviations from breakeven.


Energy IN is the change, above or below breakeven, of energy acquired by the planet. The hypothesis is made that this energy IN surplus (or deficit) is proportional to the time-integral of the annual average sunspot numbers. Since the average daily sunspot number is reported for each year, the time-integral for a period, obtained by numerical integration (same as ‘running total’), is simply the summation of annual, average daily values for the period.


Radiant energy emitted spaceward from the planet is a function of the time-integral of the fourth power of the global mean absolute temperature. Energy OUT is the amount above or below breakeven.


The change in stored energy is the anomaly (temperature minus a constant) times the effective thermal capacitance 1. Thus the anomaly is found by dividing the IN-OUT difference by the effective thermal capacitance.


Influence of sunspot numbers


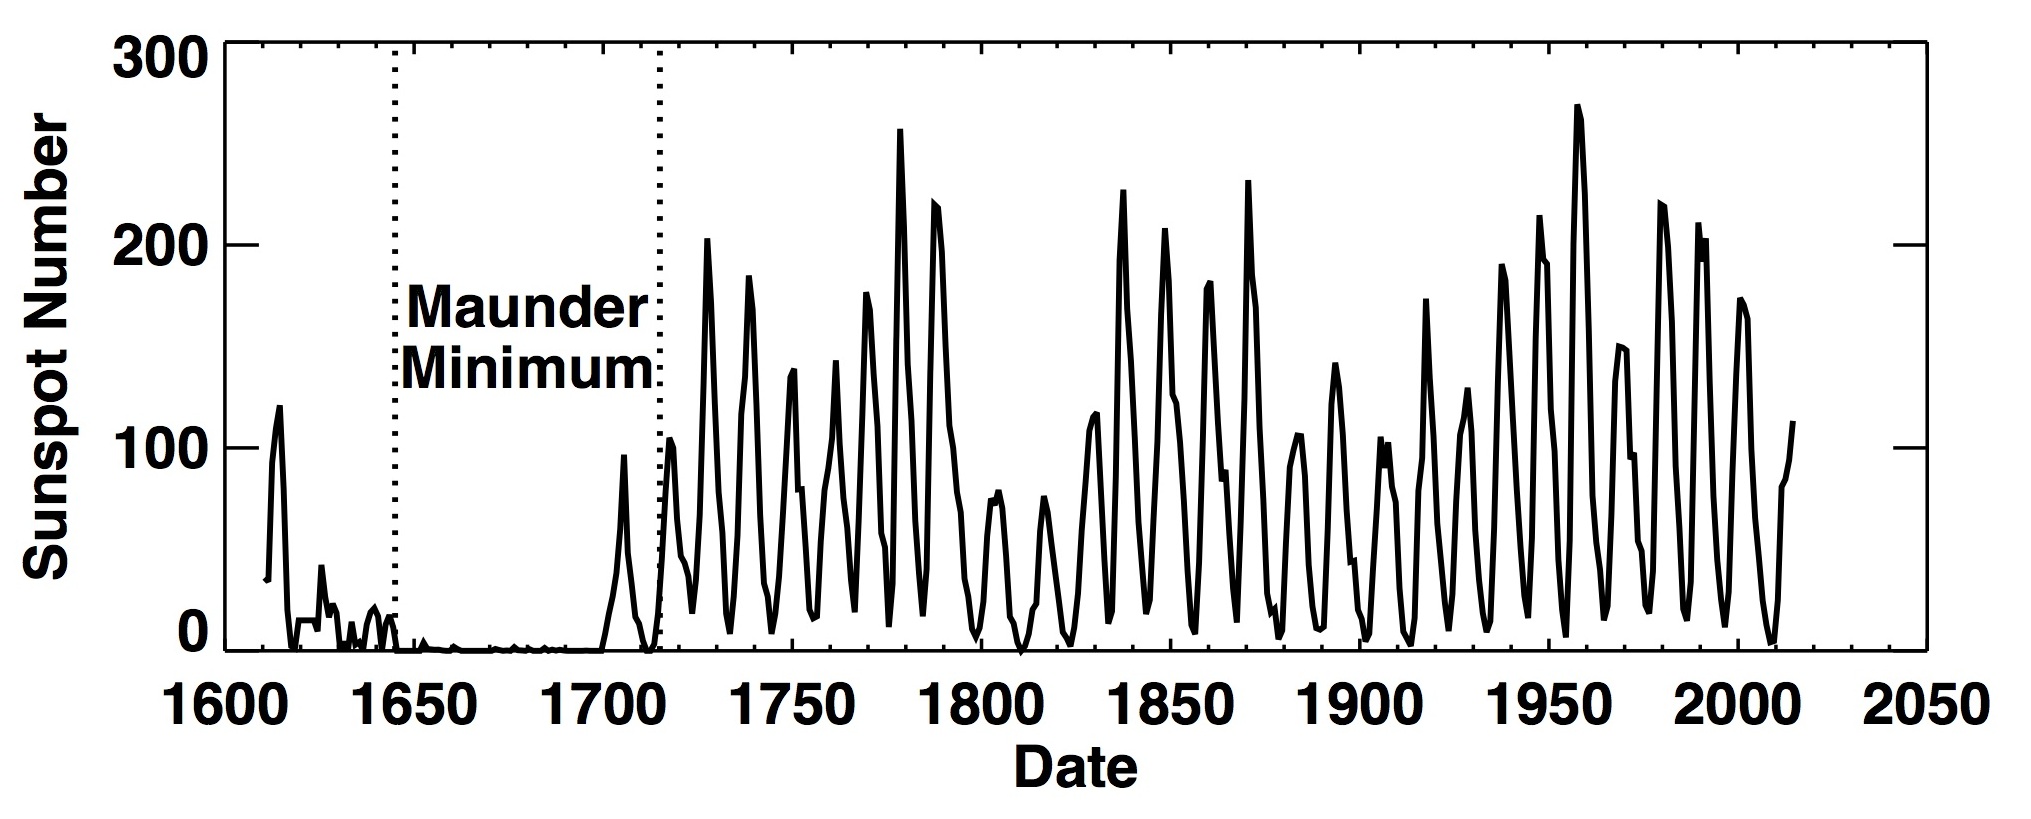
Sunspot numbers have been regularly recorded since 1610. NASA provides a fairly descriptive website 2 with some background information. The following graph 3, Figure 1, shows recorded sunspot numbers.


 Figure 1. Sunspots have been regularly recorded for over 400years.


The Maunder Minimum (1645-1715), an era of extremely low sunspot numbers, was associated with the Little Ice Age. The Dalton Minimum (1790-1820) was a period of low sunspot numbers and low temperatures. An unnamed period of low sunspot numbers (1880-1930) was also accompanied by comparatively low temperatures.


An assessment of this is that sunspots are somehow related to the net energy retained by the planet, as indicated by changes to average global temperature. Fewer sunspots are associated with cooling, and more sunspots are associated with warming. Thus the hypothesis is made that the rate at which the planet accumulates (or loses) radiant energy over time is dependent upon the sunspot number to some degree. Hence, changes in the amount of radiant energy retained by the planet above or below breakeven are dependent upon the time-integral of the sunspot numbers.


Also, a lower solar cycle over a longer period might result in the same increase in radiant energy retained by the planet as a higher solar cycle over a shorter period. Both magnitude and time are accounted for by taking the time-integral of the sunspot numbers, which is simply the sum of annual mean sunspot numbers over the period of study.


Radiation from the planet


The radiant energy emitted spaceward from the planet is a function of the time-integral of the fourth power of the global mean absolute temperature, here determined by adding 287.1 K to each reported anomaly as shown in Figure 2 of Reference 4. What is of interest here is the difference, above or below breakeven, which is subtracted from the net IN, above or below breakeven, to determine the energy change.


Combined equation


It is axiomatic that change to the energy retained by the planet is indicated by change to the average temperature of the planet.


An equation that calculates average global temperature anomalies (AGT) since 1895 with 90% accuracy has been reported 4. Reference 4 also shows the influence of atmospheric CO2to be insignificant so it can be removed from the equation by setting ‘C’ to zero. The influence of ocean oscillations can be removed from the equation by setting ‘A’ to zero. The offset, ‘D’ must be changed to 0.6519 to account for the different integration start point and setting ‘A’ to zero. The result, Equation (1), then calculates the trend resulting from just the sunspot number time-integral.


   (1)


Where:


Trendanom(y) = calculated temperature anomaly trend in year y, K degrees.


0.004894 = the proxy factor, B, from Table 1 in Reference 4, W yr m-2.


17 = effective thermal capacitance of the planet 1, W Yr m-2 K-1


s(i) = average daily Brussels International sunspot number in year i


43.97 = average sunspot number for 1850-1940. (i.e. from the start of AGT reporting to the start of the sustained run up)


286.8 = global mean surface temperature for 1850-1940, K.


T(i) = average global absolute temperature of year i, K,


0.6519 is merely an offset that shifts the calculated trajectory vertically, without changing its shape, so that the calculated temperature anomaly in 2005 is 0.3282 which is the calculated anomaly for 2005 if the ocean oscillation is included minus half of the ocean oscillation range, K degrees.


Sunspot numbers since 1700 are provided numerically 5,6 on the web by NOAA. Recent sunspot numbers are also reported 7. These numerical values are extended back to 1610 using Figure 1 and recorded in an EXCEL file. Figure 2 is a graph of this file.


 Figure 2: Solar cycles 1610-2012.


 Applying Equation (1) to the sunspot numbers of Figure 2 produces the trace shown in Figure 3.


 Figure 3: Anomaly trend from just the sunspot number time-integral using Equation (1).


Although average global temperatures were not directly measured in 1610 (no thermometers) or even estimated to sufficient accuracy using proxies, the anomaly that Equation (1) calculates is higher than most estimates for that time. Also, there is no way to determine for sure how much and which way the ocean cycles would influence the value. If the period and amplitude demonstrated to be valid after 1895 is assumed to maintain back to 1621, the temperature in 1621 and 2005 including the influence of ocean cycles would both be 0.2 K higher than calculated by an equation considering only the sunspot number time-integral.


Two changes to Equation (1) reduce the temperature calculated for 1621 by 0.21 K without changing the value calculated  for 2005 (42 replacing 43.97 and 0.4305 replacing 0.6519) are shown in Equation (2).


Applying Equation (2) to the sunspot numbers of Figure 2 produces the trend shown in Figure 4. Available measured average global temperatures are superimposed on the calculated values.

(2)


 Figure 4: Trend from just the sunspot number time-integral using Equation (2) with superimposed available measured data.


The offset constants were determined so that the temperature anomalies calculated for 2005 by the two equations are identical. The difference in 1909 between Equations (1) and (2) is only 0.055 K which is a small number compared to the accuracy of determination of average global temperature in 1909. Figure 4 shows that temperature anomalies calculated using Equation (2) appear to be somewhat closer to early reported measurements than using Equation (1)


Other assessments


A similar assessment of the influence of the time integral of sunspot numbers9 was made by Jim Goodridge in 2007, using Shove's index of sunspot numbers (calculated from planetary synodic periods) starting before the Maunder Minimum. His findings of the trajectory of the net energy rate are shown in Figure 5. Although his graph states ‘solar irradiance’, it is actually constructed using the time-integral of sunspot numbers from Shove's index with an appropriate scale factor.


Figure 5: Prior assessments suggest a causative relation between the time-integral of sunspot numbers ("...accumulated departure from the average of all sunspot numbers for the entire 500 year index.") and planet energy gain.


This assessment also used the time-integral of sunspot numbers as a proxy. The energy decline associated with the Little Ice Age, and the energy rise starting in approximately 1940 that led to the Anthropogenic Global Warming theories, are both observed.


Another relevant assessment has been made public at Hockey Schtick 8. Figure 6 was copied from that website by permission.


 Figure 6: Assessment 8 of the sunspot time-integral overlaid with HadCRUT3 measurements.


Here also the energy decline associated with the Little Ice Age, and the energy rise starting in approximately 1940 that led to the Anthropogenic Global Warming theories, are both observed.


Discussion


Others have looked at only amplitude or only time factors for sunspot numbers and gotten poor correlations with average global temperature. The good correlation comes by combining the two, which is what the time-integral of sunspot numbers does. 


Future temperature anomalies depend on future sunspot numbers and future ocean temperature oscillation behavior, neither of which has been confidently predicted for more than a decade or so in advance although assessments using planetary synodic periods appear to be relevant. As shown in Figure 6, the sunspot time-integral has experienced substantial change over the recorded period.


The effective global sea surface temperature oscillation, although dominated by the PDO, depends also on complex phase interaction with lesser oscillations. Considering all this, the effective sea surface oscillation can be expected to fade in and out in its contribution to AGT in future decades. However, average global temperature should continue to correlate with the time-integral of sunspot numbers, as it has ever since sunspots have been regularly recorded.


Conclusions


The time-integral of sunspot numbers alone accurately correlates with the estimated average global temperature trend for the entire period that sunspot numbers have been regularly recorded.


The net effect of ocean oscillations is to cause the surface temperature trend to oscillate above and below the trend calculated using only the sunspot number time-integral. Equation (1) of reference 4 accounts for both and also shows that rational change to the level of atmospheric carbon dioxide has no significant influence.


References:


1.      http://globaltem.blogspot.com/


2.      Sunspot background http://solarscience.msfc.nasa.gov/SunspotCycle.shtml


3.      Historical sunspot numbers,http://solarscience.msfc.nasa.gov/images/ssn_yearly.jpg


4.      http://climatechange90.blogspot.com/2013/05/natural-climate-change-has-been.html


5.   ftp://ftp.ngdc.noaa.gov/STP/SOLAR_DATA/SUNSPOT_NUMBERS/INTERNATIONAL/yearly/YEARLY.PLT


6.    ftp://ftp.ngdc.noaa.gov/STP/SOLAR_DATA/SUNSPOT_NUMBERS/INTERNATIONAL/monthly/MONTHLY


7.      Recent sunspot numbers, http://www.swpc.noaa.gov/ftpdir/latest/DSD.txt


8.      http://hockeyschtick.blogspot.com/2010/01/blog-post_23.html


9.  http://wattsupwiththat.com/2007/11/04/guest-weblog-co2-variation-by-jim-goodridge-former-california-state-climatologist/

Read More
Posted in | No comments

Obama issues executive order to insert his global warming agenda into all government activities

Posted on 12:45 by Unknown


  • Obama issues global warming executive order


November 4, 2013 by CFACT Ed, 


  • 10


    EmailShare


On Friday President Obama issued an executive order to millions of government employees to insert his global warming agenda into everything they do.


Ignoring the overwhelming evidence to the contrary, the President’s order said that, “the impacts of climate change — including an increase in prolonged periods of excessively high temperatures, more heavy downpours, an increase in wildfires, more severe droughts, permafrost thawing, ocean acidification and sea-level rise — are already affecting communities, natural resources, ecosystems, economies and public health across the nation.”


Already affecting?  Is President Obama unaware, or deliberately ignoring the fact that there has been no global warming during his entire time in office, in fact, none since the nineties, and very little before that.  Sea level is holding steady and we measure its fluctuations in millimeters.  Not only has there been nothing out of the ordinary about storm activity, we are nearing the end of what has so far been one of the gentlest hurricane seasons ever recorded.


Do the American people truly want federal bureaucrats telling them what they can build, where they must live and what they can and cannot buy all in the name of unproven global warming?


Dr. Roy Spencer is principal research scientist at the University of Alabama Huntsville and the recipient of NASA’s Exceptional Scientific Achievement Medal for his work with global temperature monitoring satellites.  He is a great friend of CFACT’s.  Dr. Spencer has put out one of his characteristically simple, yet authoritative graphical representations of world temperatures.  It shows 87 out of 90 of the climate computer models the UN and President Obama put so much faith in predicting a significantly warmer world than the one we actually live in.  Actual temperature observations run much cooler than the computer models do, disproving what the President told our government in his executive order.


President Obama is facing a crisis of confidence with the American people as they compare what he told them about Obamacare with what they actually have been forced to buy.  How long can President Obama continue to say one thing about global warming when our satellites and thermometers continue to prove the opposite?


- See more at: http://www.cfact.org/2013/11/04/obama-issues-global-warming-executive-order/#sthash.ofOmFWFb.dpuf
Read More
Posted in | No comments

What is happening to the oceans?

Posted on 12:05 by Unknown


WHAT IS HAPPENING TO THE OCEANS?


  • Date: 01/11/13


  • The Global Warming Policy Foundation

  • By Dr David Whitehouse


Fig 3 Rosen


Click on image to enlarge.


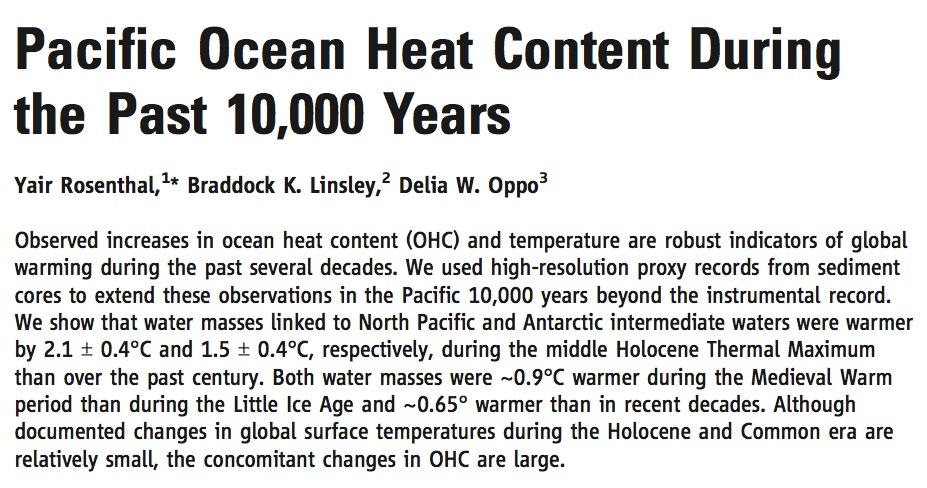
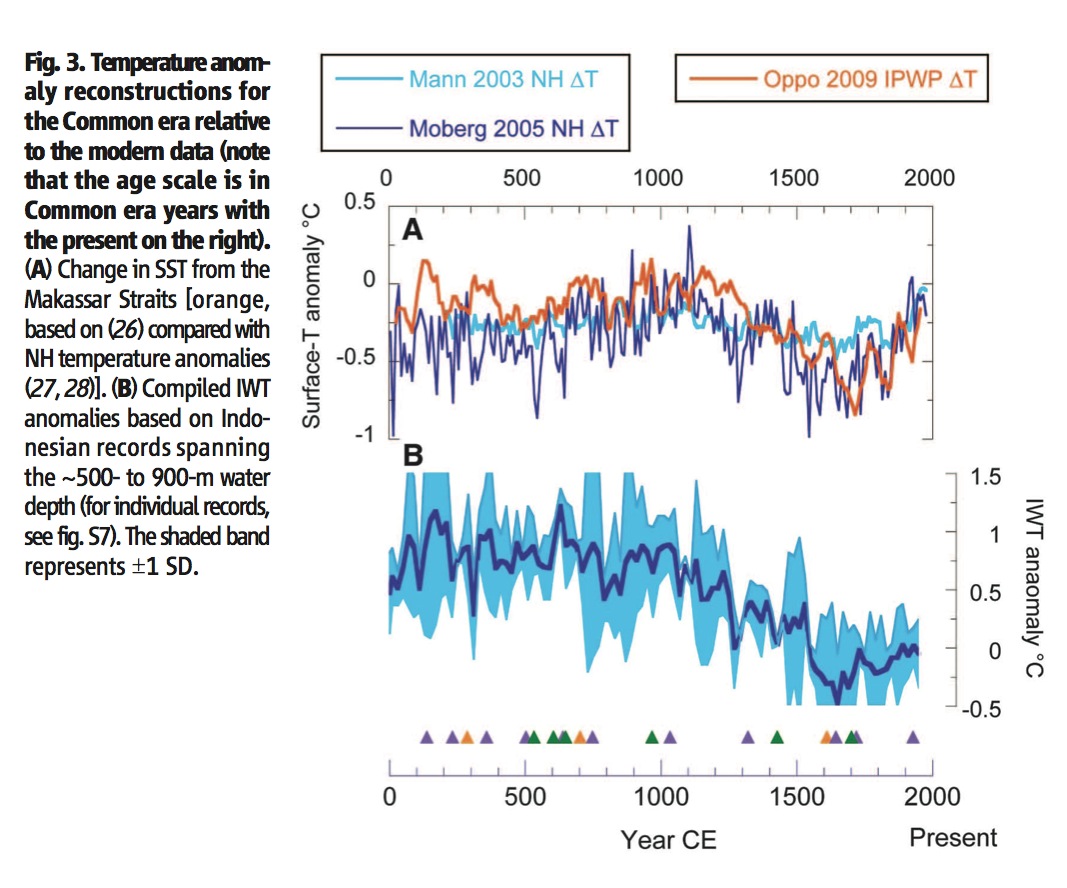
New research carried out by and published in the journal Science (University press release) is providing fascinating new insights about how the heat content of the oceans have been changing over the last few thousand years, as well as providing yet more evidence that the Medieval Warm Period and the Little Ice Age were global and not regional events.


The research involves looking for proxy historical data for the temperature of a region of the Pacific in Indonesia. This is regarded as an important stretch of water because it acts as a crossroads between extensive water masses from the northern and southern hemispheres and as such measurements made in one locale represent a much larger volume of ocean.


The work builds on the paper by Oppo et al (2009) in Nature (and see here) that studied the so-called Pacific Warm Pool – the greatest collection of warm water on Earth – and found evidence of the global extent of the Medieval Warm Period and the Little Ice Age.


Understanding how the heat content of the oceans is vital to understanding global climate change. It is believed that most – 90% – of the energy from the Earth’s energy imbalance due to man-made fossil fuels goes into the oceans and not the surface. Hence some scientists have been looking to the ocean depths to find where the energy has gone during the remarkable 16-year long pause in surface temperatures.


The current researchers looked at the isotopic signature (magnesium calcium ratio) found in the remains of shells of a certain species of marine animal – hyalinea balthica. Click on image to enlarge.


Fig 1 rosen


From studies of deposition rates they were able to provide proxy estimates of ocean temperature for various depths for the past 10,000 years – the Holocene.


The top line from this research is that it provides further evidence that the Medieval Warm Period and the Little Ice Age were not events confined to small areas but were global events.


This work also comes to other fascinating conclusions. The temperature of intermediate ocean layers, between 500 and 1000 metres, has in general declined in the last 10,000 years from the early Holocene when ocean temperatures were about 2 deg C higher than they are today. The authors also suggest that the rate of change of ocean heat content (OHC) is greater today than it has been for the past 10,000 years – a claim I will look at more closely.


The problem with the suggestion that OHC is rising faster now than at any time in the Holocene is, as the authors admit, that they have only century-scale resolution of ocean changes in the past. It is possible that similar warming rates were occurring in the past but one cannot say for certain because the ‘signal’ from the deep ocean would be averaged and smoothed over century long periods making it unlikely that changes of decades would appear in the data.


Another interesting point is that this study seems to compliment the data obtained by Marcott et al (2013), or at least the part of Marcott’s data that refers to the Holocene and not the recent data that was tagged onto his dataset. The surprising thing is that Marcott showed fairly steady (slowly declining) land temperatures throughout the Holocene whilst the current study shows deep ocean cooling.


Writing in the Huffington Post Professor Michael Mann – whose ‘hockey stick’ research once eliminated the Medieval Warm Period and the Little Ice Age – considers the scope and limitations of the research. Mann cites the PAGES 2k consortium finding published earlier this year in Nature Geoscience that finds little evidence for a global Medieval Warm Period and Little Ice Age. Mann’s criticisms make for interesting reading and shows that such research is not as settled as many would conclude after reading media reports, especially those who do little more than reproduce the headline in the hyped press release accompanying this research. At the forefront of research into ocean temperatures and heat content there are more questions than answers.


Ten thousand years ago it seems that the OHC was much larger than it is today, and it was declining. During the Medieval Warm Period it was much larger than today (though curiously the ocean temperature was not that much higher) but only a few centuries later – the Little Ice Age of the 17th century – OHC was substantially lower than today. Click on image to enlarge.


Fig 2 Rosen


Since then OHC has increased but from a very low base, so that even today it is still below general Holocene levels. Fitting these observations into an anthropogenic scheme will be interesting. Looking at the OHC data from the past two centuries one must ask the question: what is anthropogenic and what is due to the recovery from the Little Ice Age?


Related: 


New paper finds Pacific Ocean has been significantly warmer than the present throughout vast majority of past 10,000 years


Read More
Posted in | No comments

Friday, 1 November 2013

The Obamacare meltdown continues: New report says most top hospitals won't accept Obamacare

Posted on 13:04 by Unknown
This blog is dedicated to climate change issues, but now that 


  • my Blue Cross healthcare plan has been cancelled due to not meeting Obamacare requirements [along with the plans of 90 million other Americans]

  • the Obamacare website crashed after taking all of my identity theft information and I have been unable to log in to look at any plans or sign-up for a plan despite several attempts

  • and news today that my preferred top hospital facility is not on the Obamacare list [see below]


I'm sharing this news today that many others may also find themselves out of network at top-tier hospitals:


Most of the 18 hospitals on this year's U.S. News and World Report's Honor Roll will accept insurance from just one or two companies selling plans on the Affordable Care Act's (ACA) insurance exchanges, according to a Watchdog.org investigation.


Many Obamacare exchange plans do not include top hospitals


Report: Americans may find themselves out of network at top-tier facilities


November 01, 2013


Most of the 18 hospitals on this year's U.S. News and World Report's Honor Roll will accept insurance from just one or two companies selling plans on the Affordable Care Act's (ACA) insurance exchanges, according to a Watchdog.org investigation.

    >> Which Honor Roll hospitals accept your insurance under Obamacare? See the full list.


The investigative news site contacted each of the 18 hospitals on the 2013-2014 Honor Roll to determine their contracts. Investigators also spoke with insurance companies.  


The two hospitals on the top of the Honor Roll—Johns Hopkins Hospital in Maryland and Massachusetts General Hospital—are required by their state's laws to accept all insurance plans.


However, the investigation found that 11 of the remaining 16 hospitals on the list accept insurance from just one or two carriers selling plans on the exchanges. Even in states like California, where a dozen insurers are participating in the state marketplace, top hospitals accept few exchange plans, Watchdog.org noted. For example, Cedars-Sinai Medical Center will only accept insurance from one company.


University Hospitals Case Medical Center in Cleveland accepted insurance from four carriers in the exchanges, more than any other Honor Roll hospital. Meanwhile, the investigation notes that the hospitals also accept insurance plans sold outside the exchanges. For instance, Cleveland Clinic accepts dozens of insurance plans sold outside of the exchanges.


A price-quality tradeoff?


Former CMS Administrator Gail Wilensky says the investigation's findings do not come as a surprise. "There has been an incredible amount of focus on" premium costs and subsidies in the exchanges, but "precious little focus on what you get for your money," she says.

    In the exchanges, many plans will limit hospital choices


In response to the ACA's caps on premiums, insurers are expected to reimburse top-tier doctors and hospitals at lower levels. Many insurers are "concerned that [the exchanges] will be dominated by risky, high-using populations who wanted insurance [before Obamacare] and couldn't afford it," says Wilensky, adding that they "are pressed to narrow their networks to stay within the premiums."


Some experts worry that the changes will surprise consumers shopping on the exchanges, in part because many exchanges sites do not provide the names of physicians and hospitals include in the plans.


"In many cases, consumers are shopping blind when it comes to what doctors and hospitals are included in their Obamacare exchange plans," says Josh Archambault of the Foundation for Government Accountability. "These patients will be in for a rude awakening once they need care, and get stuck with a big bill for going out-of-network without realizing it," he notes.

    >> Texas hospitals, doctors still aren't sure if they're covered in the exchange


The investigation also found deeper issues with the law's implementation: "Some hospitals and doctors don't even know if they are in the network," Archambault says. For example, Seattle Children's Hospital—No. 11 on U.S. News' best pediatric hospital list—recently filed a lawsuit after it discovered it had been excluded from five of seven insurance companies in Washington's exchange (Watchdog.org/U.S. News, 10/30).


Where are the U.S. News 'Best Hospitals'?


We mapped out this year's 'Best Hospitals' and listed the five U.S. cities with the largest number of ranked hospitals.


Read More
Posted in | No comments

New paper finds US extreme heat waves have decreased since the 1930's

Posted on 08:43 by Unknown
A paper published today in the Journal of Applied Meteorology and Climatology finds that US extreme heat waves have decreased over the period from 1930-2010. According to the authors, "Several daily maximum [Extreme Heat Events] near the 1930’s led to 1930-2010 trends of daily maximum [Extreme Heat Events] decreasing" and "Maps indicated negative trends in the interior of the [continental United States] and positive trends in coastal and southern areas. Continental scale increases between 1970 and 2010 were mostly offset by the decreases between 1930 and 1970." In other words, the overall trend of US extreme heat waves was a decrease from the 1930's to the ice age scare of the 1970's, and then a return to levels still shy of those in the 1930's.


Note: The confusing sentence in the abstract below is easier to understand if broken down into the 2 components:


1. Several daily maximum EHEs [Extreme Heat Events] near the 1930’s led to 1930-2010 trends of daily maximum  EHEs [Extreme Heat Events] decreasing. 


2. Several daily (minimum) EHEs [Extreme Heat Events] near the (2000’s) led to 1930-2010 trends of daily (minimum) EHEs [Extreme Heat Events] (increasing). 


Source: Hansen Convicts Himself Of Data Tampering


Journal of Applied Meteorology and Climatology 2013 ; e-View


doi: http://dx.doi.org/10.1175/JAMC-D-13-071.1


A trend analysis of the 1930-2010 extreme heat events in the continental U.S.


Evan M. Oswald1 and Richard B. Rood


Atmospheric Oceanic and Space Sciences, University of Michigan, Ann Arbor, USA


Abstract

Extreme heat events (EHEs) are linked to mortality rates, making them an important research subject in both the climate and public health fields. This study evaluated linear trends in EHEs using the United States Historical Climatology Network (USHCN) version 2.0 dataset and quantified the longer-term EHE trends across the continental United States (CONUS).

The USHCN-daily version 1 dataset was integrated with the homogenized USHCN-monthly version 2.0 dataset to create daily data for trend analysis. Time series and estimated trends in multiple characteristics of EHEs (e.g. number, total days, mean duration, etc) were calculated as were the continental means and spatial maps. The differences between EHEs based on daily maximum temperatures, minimum temperatures and both minimum and maximum temperatures were explored. In order to focus on warming and cooling periods the trends were also estimated separately over the first half and second half of the study period (1930-2010).


The results indicated the trends for different EHE characteristics were coherent (e.g. temporally correlated, similar spatial pattern of trends). Maps indicated negative trends in the interior of the CONUS [continental United States] and positive trends in coastal and southern areas. Continental scale increases between 1970 and 2010 were mostly offset by the decreases between 1930 and 1970. Several daily maximum (minimum) EHEs near the 1930’s (2000’s) led to 1930-2010 trends of daily maximum (minimum) EHEs decreasing (increasing). Lastly, the results suggest linear trends depend on which daily temperature extreme is required to exceed the threshold. 


Read More
Posted in | No comments
Newer Posts Older Posts Home
Subscribe to: Posts (Atom)

Popular Posts

  • The green dream is not compatible with billions of the poor in search of higher living standards
    A Common Fallacy in the Energy and Climate Debate By [warmist] Schalk Cloete, The Energy Collective, 9/10/13 The vast majority of the energy...
  • UK Climate Commission submission: IPCC AR5 Report 'definitely weakens the case for action' on climate
    A submission to the UK Energy and Climate Change Committee inquiry into the IPCC AR5 Report points out how the IPCC has deliberately obscure...
  • Paper: Scientists on ice are media's nightmare
    EDITORIAL: Scientists on ice are media's nightmare The Gazette editorial •  Updated: January 4, 2014 at 8:28 am  • Published: January 4,...
  • Gavin's worry about the state of understanding of climate science comes true
    From a comment at WUWT: DB   says: December 28, 2013 at 5:34 pm Jimbo wrote: “Wasn’t Gavin for a specified period of no global surface warmi...
  • Special Report: The Age of Plenty debunks alarmist claims of food shortages
    Paging Paul Ehrlich :  IEEE Spectrum , the journal of the world's largest professional association for the advancement of technology, ha...
  • New paper finds glaciers have been melting naturally at the same rate since 1850, no acceleration predicted
    A paper published today in The Cryosphere finds global glaciers melted at the same rate in the first half of the 20th century as in the sec...
  • California Energy Commission says no to desert solar plant that could kill birds
    Finally, a bit of environmental sanity from California: California Energy Commission says no to desert solar plant that could kill birds Do ...
  • Cold fact: More record lows than highs in the USA in 2013
    Cold fact: More record lows than highs in the USA in 2013 By Doyle Rice, @USATODAYWeather, USA TODAY Posted 1/2/2014 12:00:03 AM Miley Cyrus...
  • Ship of fools finally rescued by irony
    Carbon to the Rescue Fossil fuels power retrieval of trapped climate scientists. WSJ.COM 1/2/13: Reporting on the environmental movement has...
  • Executive Summary of the NIPCC Climate Change Reconsidered II Report
    Executive Summary from the NIPCC Climate Change Reconsidered II Report, released 9/16/13: Executive Summary  This report is produced by the ...

Blog Archive

  • ▼  2014 (20)
    • ▼  January (20)
      • Record cold from global warming causing 'polar vor...
      • New paper finds glaciers have been melting natural...
      • Paper finds solar amplification mechanism via clou...
      • Game Over! IPCC Quietly Concedes Defeat
      • Gavin's worry about the state of understanding of ...
      • Renowned physicist Freeman Dyson: Global warming i...
      • UK Climate Commission submission: IPCC AR5 Report ...
      • Paper: Scientists on ice are media's nightmare
      • Bravo! Global carbon markets' value dropped 38% in...
      • Global warming believers are today's climate deniers
      • Fossil Fuels to the Rescue in Antarctica
      • Antarctic ice shelf melt 'lowest ever recorded, gl...
      • The Alps defy global warming - but no one wants to...
      • WSJ: 'We long for the days when the weather wasn't...
      • New research shows Greenland is melting naturally ...
      • 5 million Scottish trees felled for wind farms, no...
      • California Energy Commission says no to desert sol...
      • Cold fact: More record lows than highs in the USA ...
      • 71 new papers reported in 2013 demonstrating the S...
      • Ship of fools finally rescued by irony
  • ►  2013 (480)
    • ►  December (77)
    • ►  November (64)
    • ►  October (65)
    • ►  September (130)
    • ►  August (108)
    • ►  July (36)
Powered by Blogger.

About Me

Unknown
View my complete profile