Express Global

  • Subscribe to our RSS feed.
  • Twitter
  • StumbleUpon
  • Reddit
  • Facebook
  • Digg

Monday, 14 October 2013

New paper shows climate models falsely predicted Antarctic sea ice would decline more than Arctic sea ice

Posted on 17:47 by Unknown
A paper published today in Quaternary Science Reviews shows that climate models falsely predicted Antarctic sea ice would decline more than Arctic sea ice over the 20th century. In reality, Antarctic sea ice is currently near the highest levels recorded by satellites since 1979, and has almost completely offset the Arctic sea ice changes since 1979. The current Antarctic sea ice anomaly of +1 million square km is shown by the added red arrows below, and is about 2 million square kilometers above the decline falsely predicted by the mean of five climate models for the year 2000.


Note added red arrows show current sea ice anomalies in the Northern and Southern Hemispheres compared to 5 climate model simulations.

Fig. 7. Anomaly of annual mean sea ice area (in 106 km2) simulated in five different models over the last millennium in the northern hemisphere and in the southern hemisphere. LOVECLIM1.2 results are in red, MPI-ESM-E1 in light blue, MPI-ESM-E2 in dark blue, MPI-ESM-P in violet, CCSM4 in green. The reference period is 1850–1980 AD and a 21-year running mean has been applied to the time series.


Fig. 6. Time series of the anomaly of ice extent (in 106 km2) a) in the northern hemisphere in summer (September), b) in the northern hemisphere in winter (March), c) in the southern hemisphere in summer (March), d) in the southern hemisphere in winter (September). The results of ECHAM5/MPI-OM are in black (simulation covering the last 6000 years, Fischer and Jungclaus, 2011). Five simulations covering the last 8000 years with LOVECLIM1.1 using different model parameters are in green, yellow, red, magenta and violet (Goosse et al., 2007). The parameters that are varied are mainly related to the radiative scheme leading to climate sensitivities ranging from 1.6 to 3.8 K. An additional simulation with ECBILT-CLIO over the last 9000 years is in light green (Renssen et al., 2009). Compared to the other simulations, this longer simulation includes a forcing related to the presence of remains of the Laurentide during the early Holocene (effect on the surface albedo, elevation and freshwater forcing). Note that the plotted time series end in 1850 as some simulations does not include anthropogenic forcings. The reference period is 1000–1850 and a 51-year running mean has been applied to the time series. 


Modelling past sea ice changes


H. Goossea, , , D.M. Rocheb, A. Mairessea, M. Bergerd


  • a Université catholique de Louvain, Earth and Life Institute, Georges Lemaître Centre for Earth and Climate Research, Place Pasteur 3, B-1348 Louvain-la-Neuve, Belgium

  • b Laboratoire des Sciences du Climat et de l'Environnement (IPSL-CEA/INSU-CNRS/UVSQ), Gif-sur-Yvette, France

  • c Cluster Earth & Climate, Faculty of Earth and Life Sciences, Vrije Universiteit Amsterdam, Amsterdam, The Netherlands

  • d Royal Institute of Technology, KTH Department of Mechanics, Stockholm, Sweden


A dominant characteristic of the available simulations of past sea ice changes is the strong link between the model results for modern and past climates. Nearly all the models have similar extent for pre-industrial conditions and for the mid-Holocene. The models with the largest extent at Last Glacial Maximum (LGM) are also characterized by large pre-industrial values. As a consequence, the causes of model biases and of the spread of model responses identified for present-day conditions appear relevant when simulating the past sea ice changes. Nevertheless, the models that display a relatively realistic sea-ice cover for present-day conditions often display contrasted [opposite] response for some past periods. The difference appears particularly large for the LGM in the Southern Ocean and for the summer ice extent in the Arctic for the early Holocene (and to a smaller extent for the mid-Holocene). Those periods are thus key ones to evaluate model behaviour and model physics in conditions different from those of the last decades. Paleoclimate modelling is also an invaluable tool to test hypotheses that could explain the signal recorded by proxies and thus to improve our understanding of climate dynamics. Model analyses have been focused on specific processes, such as the role of atmospheric and ocean heat transport in sea ice changes or the relative magnitude of the model response to different forcings. The studies devoted to the early Holocene provide an interesting example in this framework as both radiative forcing and freshwater discharge from the ice sheets were very different compared to now. This is thus a good target to identify the dominant processes ruling the system behaviour and to evaluate the way models represent them.


Read More
Posted in | No comments

Saturday, 12 October 2013

Review paper finds the Medieval Warm Period was worldwide and warmer than the present

Posted on 09:55 by Unknown
A new review paper from SPPI and CO2 Science concludes "that earth's current level of warmth need not be attributed to the current high level of the air's CO2 content; for the peak warmth of the global Medieval Warm Period was even greater than it has been over the past couple of decades, and at a time when the air's CO2 concentration was approximately 100 ppm less than it is today, which suggests that whatever phenomenon was responsible for the warmth of the Medieval Warm Period could also be responsible for the [current warm period]."


mwp_asian_countries.png


For the Full Report in PDF Form, please click here.


[Illustrations, footnotes and references available in PDF version]


Excerpts:


Climate alarmists have long contended that the Medieval Warm Period (MWP) was not a worldwide phenomenon, primarily because that reality would challenge another of their major claims, i.e., that late 20th-century temperatures were the warmest of the past millennium or more. Thus, it is important to know what has been learned about this subject in different parts of the world; and in this summary attention is focused on Asian countries other than China, Russia and Japan, which are treated individually in other MWP Summaries.


Off the coast of Israel … they found evidence for the MWP centered around AD 1200. In discussing their findings, they make particular mention of the fact that there is an abundance of other well-documented evidence for the existence of the MWP in the Eastern Mediterranean.


Once again, there is additional evidence for solar forcing of climate at decadal and multi-decadal time scales, as well as for the millennial-scale oscillation of climate that likely was responsible for the 20th-century warming of the globe that led to the demise of the Little Ice Age and ushered in the Current Warm Period.


Modern-day warming on the Korean peninsula is only slightly greater than what occurred there back in the Medieval Warm Period. And if one looks a little further back in Park's temperature reconstruction, it can be seen that approximately 2200 years ago it may actually have been slightly warmer than it was near the end of the 20th century AD, suggesting that there is nothing unusual or unnatural about the earth's current level of warmth.


Although they do not directly say it in their paper, the findings of Kaniewski et al. thus do indeed reveal whether or not "recent climate trends are atypical or not over the last millennium." And the answer is: They are not ... at least not in the region of Syria they studied, and not in most of the other parts of the world for which there is evidence of the MWP. And this result clearly suggests that earth's current level of warmth need not be attributed to the current high level of the air's CO2 content; for the peak warmth of the MWP was even greater than it has been over the past couple of decades, and at a time when the air's CO2 concentration was approximately 100 ppm less than it is today, which suggests that whatever phenomenon was responsible for the warmth of the Medieval Warm Period could also be responsible for the warmth.


In conclusion, as ever more real-world temperature data continue to be obtained, and as more correct procedures are employed to analyze them, Asia's (and the world's) true temperature histories are becoming ever more clear; and what's beginning to take shape will ultimately spell the end of the IPCC's ill-conceived rush to judgment on identifying both the nature and the cause of the post-Little Ice Age climatic amelioration of the planet.

Read More
Posted in | No comments

New paper finds natural North Atlantic Oscillation controls Northern Hemisphere temperatures 15-20 years in advance

Posted on 09:25 by Unknown
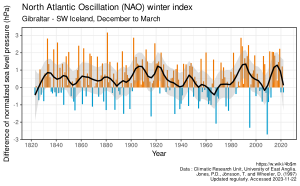
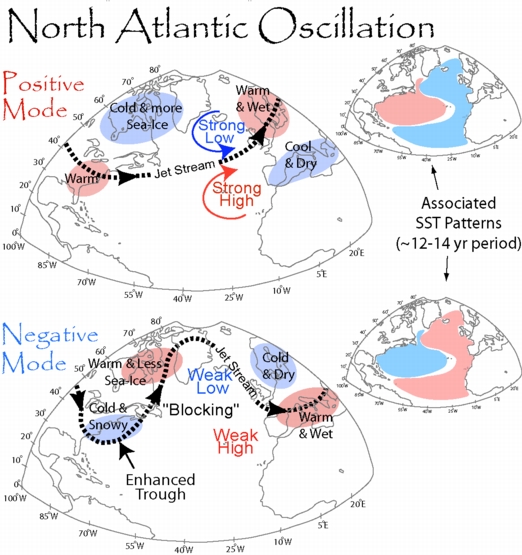
A new paper published in Geophysical Research Letters finds the natural North Atlantic Oscillation [NAO] controls temperatures of the Northern Hemisphere 15 to 20 years in advance, a lagged effect due to the large thermal inertia of the oceans. The authors find the NAO index can be used to predict Northern Hemisphere mean temperature multidecadal variability and the natural oceanic Atlantic Multidecadal Oscillation (AMO) 15–20 years in advance. A simple linear model based upon this theory predicted the 'pause' of global warming since about 2000 that IPCC models failed to predict, and projects Northern Hemisphere temperatures will "fall slightly" over the 15 years from 2012-2027. 


The NAO, in turn, has been linked to solar activity.


NAO winter index


NAO implicated as a predictor of Northern Hemisphere mean temperature multidecadal variability


Jianping Li 1,*, Cheng Sun 1, Fei-Fei Jin 2


DOI: 10.1002/2013GL057877


The twentieth century Northern Hemisphere mean surface temperature (NHT) is characterized by a multidecadal warming–cooling–warming pattern followed by a flat trend since about 2000 (recent warming hiatus). Here we demonstrate that the North Atlantic Oscillation (NAO) is implicated as a useful predictor of NHT  [Northern Hemisphere Temperature] multidecadal variability. Observational analysis shows that the NAO leads both the detrended NHT  [Northern Hemisphere Temperature] and oceanic Atlantic Multidecadal Oscillation (AMO) by 15–20 years. Theoretical analysis illuminates that the NAO precedes NHT multidecadal variability through its delayed effect on the AMO due to the large thermal inertia associated with slow oceanic processes. A NAO-based linear model is therefore established to predict the NHT, which gives an excellent hindcast for NHT in 1971–2011 with the recent flat trend well predicted. [Northern Hemisphere Temperature] NHT in 2012–2027 is predicted to fall slightly over the next decades, due to the recent NAO weakening that temporarily offsets the [theoretical] anthropogenically induced warming.

Read More
Posted in | No comments

Thursday, 10 October 2013

WSJ Op-Ed: We have to kill eagles with wind turbines in order to save them

Posted on 17:06 by Unknown


Fighting Climate Change by Killing Eagles


Why isn't the wind industry subject to the Bald and Golden Eagle Protection Act?


    By 
  • ROBERT BRYCE


For some environmentalists, the threat of climate change is so great that we must allow wind turbines to kill bald and golden eagles. The argument I've heard is that renewables, including wind energy, will reduce the amount of carbon dioxide in the atmosphere. Less carbon dioxide reduces the threat posed by climate change, which benefits eagles and other wildlife.


In other words, we have to kill eagles in order to save them.


If this sounds far-fetched, consider the notice that the U.S. Fish and Wildlife Service published in the Federal Register on Sept. 27. It seeks public comment on a proposed permit that will allow a wind project to kill up to five golden eagles over a five-year period, despite their protected status under the Bald and Golden Eagle Protection Act.


The permit is sought for the Shiloh IV Wind Project in Solano County, Calif. If it is granted, it would formally recognize a legal double standard that is already in existence with regard to wildlife protection in America.


Wind projects routinely violate the Bald and Golden Eagle Protection Act and the Migratory Bird Treaty Act, but no wind farm has ever faced a single prosecution. Meanwhile, companies in the oil and gas industry and other sectors are routinely indicted for violating those same statutes.


The illegal bird kills are not insubstantial. On Sept. 11, some of Fish and Wildlife's top raptor biologists published a study in the Journal of Raptor Research that found the number of eagles killed by wind turbines increased to 24 in 2011 from two in 2007. In all, some 85 eagles have been killed since 1997. Joel Pagel, the study's lead author, recently told me that the figure is "an absolute minimum." Among the carcasses: six bald eagles.


image


image


Associated Press

A golden eagle flies near a wind turbine on a wind farm near Glenrock, Wyo.


Mr. Pagel's study was published just five months after Fish and Wildlife issued a report that stated "there are no conservation measures that have been scientifically shown to reduce eagle disturbance and blade-strike mortality at wind projects." So if more turbines are built, more eagles will be killed.


Wind turbines overall kill some 573,000 birds per year including 83,000 birds of prey, according to a study this March in the Wildlife Society Bulletin. Yet the effect that wind power has on reducing global carbon-dioxide emissions is so small as to be insignificant. Elementary math proves that point.


The American Wind Energy Association claims that in 2012 wind energy production reduced domestic CO2 emissions by 80 million tons. Last year, global emissions of that gas totaled 34.5 billion tons. Thus, the 60,000 megawatts of U.S. wind-generation capacity reduced global carbon-dioxide emissions by about two-tenths of 1%. To achieve a 1% reduction in global carbon-dioxide emissions, the U.S. would have to install at least 120,000 more turbines (assuming each machine has a capacity of two megawatts).


Last year, all of the wind turbines on the planet provided the energy equivalent of about 2.4 million barrels of oil per day. But over the past decade, the annual increase in coal use averaged some 2.6 million barrels of oil equivalent per day. Merely to keep pace with the soaring growth in coal usage, the world's electricity producers would have to nearly replicate the entire global fleet of wind turbines—some 285,000 megawatts of capacity, or roughly 142,000 turbines—every year.


There are two scandals here. First, wind turbines are killing legally protected eagles in the name of slowing climate change, but whatever reductions in carbon-dioxide emissions that may be occurring is equivalent to a baby's burp in a hurricane.


Second, the wind-energy industry is lobbying to extend a production tax credit—the 2.2 cent-per-kilowatt-hour subsidy that has fueled the turbine-building craze over the past few years. Last year the subsidy was extended for one year, at a cost to taxpayers of $12 billion. Another one-year extension will cost an additional $6.1 billion, according to a recent estimate by the congressional Joint Tax Committee.


It's bad enough that this so-called green industry wants to continue killing eagles with impunity. Taxpayers should not be subsidizing the slaughter.


Mr. Bryce is a senior fellow at the Manhattan Institute.


Read More
Posted in | No comments

New paper finds SW Pacific Ocean surface temperatures were about the same as today, ~200,000 years ago

Posted on 14:29 by Unknown
A new paper published in Quaternary Research finds sea surface temperatures in the SW Pacific Ocean were about the same as the present 200,000 years ago. According to the authors, "Statistical results suggest that annual averages of sea-surface temperature (SST) and salinity (SSS) at ~ 197,000 [years ago] were not significantly different from and ~ 1.2 higher than at present, respectively."

The authors also find sea levels in the SW Pacific were up to ~10 meters [~32 feet] higher than the present during the last interglacial ~120,000 years ago.


Horizontal axis is thousands of years before the present


MIS 7 interglacial sea-surface temperature and salinity reconstructions from a southwestern subtropical Pacific coral


  • Ryuji Asamia, b, Corresponding author contact information, E-mail the corresponding author, 

  • Yasufumi Iryuc, d, 

  • Kimio Hanawae, 

  • Takashi Miwad, 

  • Peter Holdenf, 

  • Ryuichi Shinjob,

  • Gustav Paulayg


  • a Trans-disciplinary Research Organization for Subtropical Island Studies (TRO-SIS), University of the Ryukyus, 1 Senbaru, Nishihara, Okinawa 903-0213, Japan

  • b Faculty of Science, Department of Physics and Earth Sciences, University of the Ryukyus, 1 Senbaru, Nishihara, Okinawa 903-0213, Japan

  • c Department of Earth and Planetary Sciences, Graduate School of Environmental Studies, Nagoya University, Nagoya 464-8601, Japan

  • d Institute of Geology and Paleontology, Graduate School of Science, Tohoku University, 6-3 Aramaki-aza-Aoba, Aoba-ku, Sendai 980-8578, Japan

  • e Physical Oceanography Laboratory, Department of Geophysics, Graduate School of Science, Tohoku University, 6-3 Aramaki-aza-Aoba, Aoba-ku, Sendai 980-8578, Japan

  • f Research School of Earth Sciences, The Australian National University, Bldg 61, Mills Road, Acton, ACT 0200, Australia

  • g Florida Museum of Natural History, University of Florida, Gainesville, FL 32611, USA


We generated a 5.5-yr snapshot of biweekly-to-monthly resolved time series of carbon and oxygen isotope composition (δ13C and δ18O) and Sr/Ca and Mg/Ca from annually banded aragonite skeleton of a ~ 197 ka pristine Porites coral collected at Niue Island (19°00′S, 169°50′W) in the southwestern subtropical Pacific Ocean. This report is the first of a high-resolution coral-based paleoclimate archive during the Marine Isotope Stage (MIS) 7 interglacial. Statistical results suggest that annual averages of sea-surface temperature (SST) and salinity (SSS) at ~ 197 ka were not significantly different from and ~ 1.2 higher than at present, respectively. Monthly mean variations showed increased SSS at ~ 197 ka that was higher (1.4–1.9 relative to today) in the austral summer than in the austral winter. Monthly SST and SSS anomalies at ~ 197 ka indicated smaller amplitudes by ~ 0.3°C (11%) and ~ 0.3 (24%) relative to the present, possibly suggesting less influence of interannual climate variability around Niue. Our results, taken together with other climate proxy records, imply seasonal and interannual modulation of thermal and hydrological conditions, different from today, in the southwestern subtropical Pacific Ocean associated with the Western Pacific Warm Pool and the South Pacific Convergence Zone variability during the MIS 7 interglacial.


Read More
Posted in | No comments

Wednesday, 9 October 2013

New paper finds no evidence of AGW in West Antarctica

Posted on 22:54 by Unknown
A paper published today in Geophysical Research Letters finds no evidence of anthropogenic climate change in West Antarctica over the past ~300 years. According to the authors, more warming "occurred in the mid-19th and 18th centuries, suggesting that at present the effect of anthropogenic climate drivers at this location has not exceeded the natural range of climate variability in the context of the past ~300 years."

A 308-year record of climate variability in West Antarctica

Elizabeth R Thomas 1,*, Thomas J Bracegirdle 1, John Turner 1, Eric W Wolff 2

DOI: 10.1002/2013GL057782


We present a new stable isotope record from Ellsworth Land which provides a valuable 308-year record (1702-2009) of climate variability from coastal West Antarctica. Climate variability at this site is strongly forced by sea surface temperatures (SSTs) and atmospheric pressure in the tropical Pacific and related to local sea ice conditions. The record shows that this region has warmed since the late 1950s, at a similar magnitude to that observed in the Antarctic Peninsula and central West Antarctica, however, this warming trend is not unique. More dramatic isotopic warming (and cooling) trends occurred in the mid-19th and 18th centuries, suggesting that at present the effect of anthropogenic climate drivers at this location has not exceeded the natural range of climate variability in the context of the past ~300 years.

Read More
Posted in | No comments

Father of chaos theory explains why it is impossible to predict weather & climate beyond 3 weeks

Posted on 10:21 by Unknown
An article published today in the Bulletin of the American Meteorological Society may be the last interview with the father of chaos theory, MIT professor Dr. Edward Lorenz, and has essential implications for climate modelling. In the 2007 interview, Dr. Lorenz confirms that chaos theory proves that weather and climate cannot be predicted beyond the very short term [about 3 weeks], and that even with today's state-of-the-art observing systems and models, weather [or climate] still cannot be predicted even 2 weeks in advance. 


Dr. Lorenz notes that although other fields that deal with complex, non-linear systems have accepted the implications of chaos theory, some meteorologists and climatologists remain reluctant to accept the implications of chaos theory, namely that long-term climate forecasting is impossible.


According to chaos theory, all the current "initial' conditions throughout the atmosphere must be known precisely to predict what the atmosphere will be doing in the distant future. In addition, one must know all the current conditions throughout the oceans as well, since the oceans control the atmosphere. “In view of the inevitable inaccuracy and incompleteness of weather observations, precise very-long-range forecasting would seem to be nonexistent,” Lorenz concluded. So even if the molecules in the air all interacted nonrandomly, in a totally cause-and-effect (deterministic) manner, you still couldn’t predict with certainty what they would do or what the weather would be."


Chaos theory also debunks the claim of some climatologists that although models cannot predict short-term climate variations such as the current 20 year "pause," they can still be used for long-term projections. Chaos theory instead proves that uncertainty of projections increases exponentially with time, and therefore, long-term climate model projections such as throughout the IPCC AR5 report are in fact impossible to rely upon. 
Full PDF

Bulletin of the American Meteorological Society 2013 ; e-View
doi: http://dx.doi.org/10.1175/BAMS-D-13-00096.1

Last Interview with Professor Edward Lorenz? - Revisiting the “limits of predictability” - Impact on the Operational and Modeling Communities?

Robert W. Reeves

NOAA/NWS/OCWWS, Silver Spring, Maryland UNITED STATES

More than 50 years ago, Massachusetts Institute of Technology (MIT) Professor Edward Lorenz conducted some numerical experiments with a simple 12-variable system representing convective processes. He had begun work on a statistical forecasting project, but disagreed with some of the thinking at the time, in particular that the primarily linear statistical methods could duplicate what the nonlinear methods achieved. He proposed to demonstrate this by performing numerical time integrations of his simple model with his newly-acquired desk-top computer. On one occasion he wanted to reexamine the results from an earlier simulation. Rather than re-run the simulation from the initial state, he decided to pick up the computations part-way into the original run by using the printout from the earlier run as the starting point. To his astonishment the new simulation diverged significantly from the original. Eventually he realized that the initial values he used for the second simulation were rounded off from the initial run so that the initial values of his second run were slightly different. The minor differences at initialization were magnified later in the run and led to very different end states. Lorenz (1963) concluded that if the real atmosphere evolved similarly to his numerical simulation, then very long-range prediction would not be possible. If Lorenz’ work was valid, then this could significantly alter the course of long-range prediction history. What would Lorenz have to say about that? I requested an interview for the primary purpose of eliciting his views.

The Interview

R.R - It’s Tuesday, November 6, 2007. I am with Emeritus Professor Edward Lorenz from MIT. Professor Lorenz I would like to ask you to discuss your activities and views related to the topic of extended and long-range prediction. Your numerical experiments 
in the early ‘60s, which you published in ’63 entitled “Deterministic Non-periodic Flow,” suggested that there are practical limits to weather prediction. But before we go there I’d like to ask you to go back to the time that you came to MIT and some of the topics you were working on at that time.

E.L. - I came here shortly after we got involved in World War II. I signed up for the meteorology program at MIT which was part of the Army Air Corps there. At that time MIT was a nice convenient place for me because I was at Harvard and I didn’t have to move until the Army decided to move us all under the same place. But for the first month or so I kept on living at Harvard and the course was the regular graduate course in Meteorology at MIT, except it was crowded into a shorter period. So, I studied Meteorology in the course, and after that I was one of five students out of a hundred that they kept here as instructors for the next course. I think there were nearly 400 at that time taking it and stayed on for the next session after that. I was in the 3rd so I taught in the 4th and 5th, and after that they stopped the teaching program. They found they had more meteorologists than they needed and a lot of them were being assigned to other duties at that time because they had trained too many.

R.R. - So you were teaching cadets then?

E.L. - I was teaching cadets – yes mostly cadets. I guess there were other people taking the course at the same time. A few civilians and some Navy and they were all together. R.R. Were you in the Ph.D. program at the time?

E.L. No. Although I was in a Master’s program. When we stayed on as instructors, they gave us an option to do a Master’s thesis at the same time. We got a Master’s degree. But it was after the War and I got into the Ph.D. program and after about a year and a half I finally got my Ph.D.

R.R. And then you were working on angular momentum problems?

E.L. Well no, not at that time. This was after Victor (Starr)1 came and after I got my degree. I needed a job, or course, and they offered me one working with Victor Starr as a post-Doc. He was very much interested in angular momentum. So that’s when I got involved with that.

R.R. How did you get started in the studies that ended up related to the limits of predictability?

E.L. What happened was that at the same time there was a program which I didn’t know much about in statistical weather forecasting here which Tom Malone2 was directing; and Tom left to form and head up the Travelers Weather Service in Hartford. So they offered me his position which I accepted. And along with his position I also inherited his project. I had to learn something about statistics, so I got involved with statistical weather forecasting. And a lot of the things they said about it were current knowledge of statistical weather which I didn’t quite agree with. One was that most of the statistical methods then were primarily linear methods and I didn’t agree with the idea that linear 
methods could almost duplicate what the nonlinear methods were able to do, so I proposed a test where we could get extensive solutions. Computers were just coming in then, and we wanted to get some small system - any nonlinear system would do – to generate some extended solutions, and treat them as if they were observational data. Then we could see if we were able to forecast them by linear methods, knowing that we could forecast by nonlinear methods just by repeating the computations that produced the solution in the first place. This led to a number of things: I soon found that it wasn’t 


easy to get nontrivial solutions; we could numerically solve for periodic solutions, which was where the prediction was trivial anyway. I finally managed to produce one, which was what I wanted, that definitely appeared to be non-periodic. It was a 12-variable model and that was essentially the first one that I worked with, although I got the idea that sufficiently long-range prediction would be impossible if the atmosphere behaved in the way that the model did.

R.R. So you had just run one time integration then, is that right?
E.L. The difficulties were in finding a suitable system of equations to work with because if I had known exactly what equations to choose in the first place, and exactly what initial states to take in order to get this nonperiodic solution, I probably could have done the whole thing in a couple of months or so with hand computations which is about the same time it would take to write up the thing afterwards for publication. So it wouldn’t have taken much more time, but the problem of course is that I had to make many, many tries with many different systems. Even if I’d had the right system I wouldn’t know if I had initial conditions that didn’t work very well. It’s not just a matter of initial conditions,
but once we have the general form of the equations, you have the numerical value of the constants. Some constants will produce what we now call chaotic behavior and some won’t. So it meant trying out an enormous number of things, more than I ever could possibly have gone through without the computers. So this type of work had to wait until computers were available. So it’s the kind of thing that we couldn’t have imagined in the ‘50s, let’s say, or before then. Although computers existed by then they weren’t so sufficiently common to be used for this particular purpose – they were usually earmarked for something else. But by 1960 – I guess it was about ’58 or ’59, I finally got my own computer for the office - a little LGP (Librascope General Purpose) computer about the size of a regular desk, and it was ideal for these purposes because it was still a thousand times as fast as hand computations and fast enough to handle these small systems that I worked with. Then with the 3-variable model I finally used in the write-up in ’63, I felt I could make things a little clearer and get the points across better by using a smaller model than the 12-variable model. I spent some time looking for a model with fewer variables, and I finally found this one that Saltzman3 had been working with. He had his 7-variable model but he showed me one case that first of all wouldn’t settle down to a periodic solution, which was what he was interested in; and second, four of the seven variables stayed close to zero, which suggested that the other three were keeping each other going; and if I reduced it to those three it would behave the same way, which it did. R.R. Was he a student of yours then, Barry Saltzman?

E.L. He was actually a student of Victor Starr’s. But he took some of my courses and I knew him quite well. I saw him quite often afterwards up until the time he died. R.R. So now you ran that model and published the results in 1963. Is that right? E.L. Yes.

R.R. Did you realize the implications of your work at that point?

E.L. I never really expected them to spread to so many other fields. I think I realized the implications for meteorology and some meteorologists didn’t quite agree with what I had to say, but fortunately Charney4 did. And he was in a very influential position then. This was at the beginning of the Global Atmospheric Research Programme (GARP)5, and one of the original aims of GARP had been to make two-week forecasts, and this suggested that they might be proved impossible before we even got started. So we were able to change the aim to investigate the feasibility of two-week forecasts, not promising that they would be possible. Now it begins to look as if the upper limit may be somewhere around two weeks, and I get the feeling that another 20 years or so we may actually be making useful day-to-day forecasts up to the two-week range, though I don’t think we are doing it now. But we got up to one week which I didn’t really expect at the time.

R.R. So Charney was a believer right away?
E.L. Yes. He said he saw why it worked that way. And I think his ideas there are pretty well-expressed in this report he wrote which was subsequently published in the (AMS) Bulletin. It was called the Feasibility of Global Observational Analysis Experiment or similar title.6 I think it was published in the Bulletin in ’66. It may have been a published report in ’64 or ’65, or around that time. That pretty well represents his feelings on the subject. It was his whole committee that published it. I think there were five authors.
R.R. - Was Smagorinsky7 in on that?

E.L. - I’m not sure he was on that actual committee or not. Of course he was very much 
involved in this type of work.

R.R. - General Circulation Model (GCM) experiments. E.L. - Yes

R.R. - And becoming a believer himself in the limitations, do you think? E.L. - I think so.

R.R. - There were others who were either skeptical or didn’t want to believe.


E.L. - Well, I guess they felt that this was a simple system of equations, and that the real atmosphere didn’t behave that way. In fact I had one person tell me, point blank, that the reason I was getting this irregular behavior was because of the numerical scheme. That the equations didn’t actually act that way, which of course we couldn’t really prove not being able to solve the equations by standard analytic methods. It seems quite definite that it’s the equations and not the numerics.

R.R. - Who was that person, do you remember?

E.L. - Yes, . . . I probably shouldn’t mention him. I wouldn’t want to put him at a disadvantage, because he has since changed his ideas on that.

R.R. - People are free to do that. I noticed that in one of your papers you credited

Arnold Glaser8 with suggesting that maybe the smaller scale would . . .


E.L. - Yes, he mentioned that to me back in the ‘50s. He was here at the time. I guess he was here as a student a long time before I got involved in meteorology. Then he came back afterwards and got his Doctorate here. Died rather prematurely.

R.R. - So then you published a number of papers after that and were conducting further experiments? Were you at that point trying to nail down the limits of predictability, so to speak? Or were you just doing other things?

E.L. - Well, I was hoping to get a better idea what the limits were because this simple model said there were limits but it didn’t tell you whether they were a week or year or what. I don’t know whether I expressed it just right or not.

R.R. - The question is where did the world of applied math go – when did they eventually pick up on some of the things that you were doing back in the ‘60s or did they not?

E.L. - I find this a little hard to answer. Sometimes I had the feeling the applied mathematicians were ahead of us. I know that there were applied mathematicians at MIT

- such as Will Malkus9 and some of the others who were very much interested in fluid dynamical programs that certainly were as well-versed in fluid dynamics as any meteorologist I guess, and I don’t know exactly when they got interested in this particular thing. They may always have been but I remember Willem Malkus told me at one time that he didn’t think the way I had done this paper was the way to go about things. But then this turned out to be because he was interested primarily in the phenomenon of convection rather than some of the other things. I finally persuaded him that I wasn’t concerned at all whether this equation really represented any physical phenomenon very
well or not; it was simply the fact that equations could do it and not that the equations of some particular phenomenon could do it. And I guess he agreed pretty well after that. R.R. - Can you say something about your own background in math and how that encouraged you?

E.L. - I majored in math in college and then I went to Harvard and I’d had almost 3 ½ years of grad study there and I was expecting to get a Ph.D. in another half year or so if everything went well when we got involved in the war. They didn’t see fit to let me finish out anyway and since I’d always enjoyed the weather, signing up for meteorology would be a good thing. I didn’t have any idea then that I would stay in meteorology afterwards. I assumed I’d eventually get back in mathematics. And in a way I wanted to. So once I got into this work in the late ‘50s, I felt that I was getting back into the mathematics by doing this.

R.R. - And coming at it from a different point of view than we meteorologists?

E.L. - Yes. Any of the mathematics that I did in my meteorology work wasn’t related to the same problems at all that I’d looked at as a mathematics student. I’d never thought about dynamical systems at that time. This is something that came up later.

R.R. - So was it more practical applications then - getting into meteorology?
E.L. - I finally decided after studying enough math that what really interested me was algebra and I was going to write a thesis in algebra. One can look at this predictability problem, if you want to call it that, from different points of view. One method is to solve for the analog method, look at the data, and if one could find a weather situation that was enough like a previous one then we could see how rapidly the development after the one would depart from the development after the other. That would give some idea of the limit of predictability. I published a paper on that in the Journal of Applied Meteorology I think10. What turned out of course was that it was impossible within the amount of data available to get any two situations which looked very much alike, at least globally and hemispherically, or we might get some that looked very much alike say over the eastern half of the US that you could always argue that if they behaved differently, that was because of different influence somewhere else rather than because of any instability there, so it wouldn’t tell you much. So what I really thought I needed were situations that were alike, if not over the globe, at least over the hemisphere, and I took five years of data and comparing each map with each other map. At least comparing those that occurred within a month of the same time of year, because you wouldn’t expect that fall maps and mid-winter maps would be much alike anyway, and hoping maybe I could find a few cases where the difference between them or some measure (say rms difference) between the two fields was only half of that between two randomly-chosen fields. But the best that I found of these few hundred thousand comparisons was one case I think where it was 62%. It didn’t seem like a very good analog somehow but it was enough to write about.

R.R. - So that was a frustrating experience trying to find analogs. Did you think ahead of time it was going to be tough to do?

E.L. - When I started I expected to find better analogs than actually appeared there. The upper air data record had not been in existence for very long then so it was difficult to find suitable analogs. If we repeated the study now we‘ve got a much longer record, 
perhaps five times as long, and have a better chance since you’re comparing everything to everything else. That would be 25 times as many cases to look at and I guess I estimate to have a good chance of finding two analogs – two maps – where the difference is only half of the average difference between any randomly chosen maps. One would need 140 years of upper level data and we haven’t got that yet. But we’re getting close to half of it.


The first thing I would say is that current numerical prediction output are much better than I ever thought they would be at this time. I wasn’t sure they would ever get as good as they are now, certainly not within my lifetime. So, this makes me think that they can become still better and makes me hopeful that we may actually get good forecasts a couple of weeks ahead some time. I still don’t hold much hope for day-to-day forecasting a month ahead. Two weeks ahead doesn’t seem unreasonable at all now even though we haven’t reached that point. And . . . I gather that a lot of the improvement has been from the improvement in initial conditions, and in turn, improvement in data assimilation methods. I’m still surprised, although it has been known for a great many years now that so much of the total time in numerical forecasts is spent on the data assimilation rather than on the actual forecasting, even when you make an ensemble forecast of 50 members or so. Still an enormous amount of the time is actually the data assimilation time. And I’m convinced that there will some day be better methods of data assimilation which incorporate the nonlinearity better than we are able to now in the assimilation process. I don’t know just what they are – every time I look at the thing and try to see if I can learn something new I get discouraged pretty soon. I haven’t come up with anything.


R.R. - So you have at least been thinking about that problem?

E.L. - I think the meteorological community accepted the idea of limitations to the forecasts. Of course, the idea wasn’t new then. You can find it quite strongly expressed in some of the earlier papers. Particularly one of the papers by Eady11 around 1950 where he points out that that any forecast given is just one member of a large ensemble of possible forecasts and we have no real reason for selecting among those.

R.R. - And he was saying that in 1950?


E.L. - He was saying that early. I think he was as advanced as any meteorologist at the time, and it was certainly a tragedy that he didn’t live longer. I remember thinking of him as a somewhat older meteorologist but actually I think he was about my age. So he must have died when he was in his 40’s. And other people have expressed similar views even earlier. But sometimes these are almost taken as jokes saying that someone sneezing in China will cause a snowstorm in New York. You can find that way back, at least to the early ‘40s, but maybe before that. You must know Jim Fleming12. He found one thing around 1915 in the Monthly Weather Review (MWR) where there was reference to possible effect of some insects on the weather. It was someone by the name of Franklin (1918) who was actually at MIT, although I don’t think he was a meteorologist. But he did write about this thing in the Monthly Weather Review. And he pointed out the possibility of this large amplification of small influences. I do think that the meteorology community accepted it pretty well, perhaps partly because of Charney’s influence. And proliferation to other fields of the ideas of chaos did not come until another ten years or so after that and was unrelated to any feelings the meteorology community might have had.

R.R. - OK. Prof Lorenz, thank you for sharing your work with us. E.L. - Well, I’m glad I’ve had a chance to talk with you.

CONCLUSION. The interview has provided insights into how Lorenz stumbled onto his seminal work. He inherited a project that required he learn statistics, which led him to statistical weather forecasting, while his foundation in mathematics led him to question current thinking. He was able to prove his theory that linear statistical methods could not duplicate what a system generating nonlinear solutions could achieve. While his first numerical integrations were conducted using a 12-variable model, his landmark 1963 paper (Lorenz, 1963) only used a 3-variable model, and in this interview, Lorenz gives us his path to choosing the simpler model. Lorenz also believed that improved initial conditions and data assimilation methods have led to the skill we see today in NWP [near-term weather prediction], and he was hopeful that good forecasts out to two weeks are possible.


Read More
Posted in | No comments
Newer Posts Older Posts Home
Subscribe to: Posts (Atom)

Popular Posts

  • The green dream is not compatible with billions of the poor in search of higher living standards
    A Common Fallacy in the Energy and Climate Debate By [warmist] Schalk Cloete, The Energy Collective, 9/10/13 The vast majority of the energy...
  • UK Climate Commission submission: IPCC AR5 Report 'definitely weakens the case for action' on climate
    A submission to the UK Energy and Climate Change Committee inquiry into the IPCC AR5 Report points out how the IPCC has deliberately obscure...
  • Gavin's worry about the state of understanding of climate science comes true
    From a comment at WUWT: DB   says: December 28, 2013 at 5:34 pm Jimbo wrote: “Wasn’t Gavin for a specified period of no global surface warmi...
  • Special Report: The Age of Plenty debunks alarmist claims of food shortages
    Paging Paul Ehrlich :  IEEE Spectrum , the journal of the world's largest professional association for the advancement of technology, ha...
  • Paper: Scientists on ice are media's nightmare
    EDITORIAL: Scientists on ice are media's nightmare The Gazette editorial •  Updated: January 4, 2014 at 8:28 am  • Published: January 4,...
  • California Energy Commission says no to desert solar plant that could kill birds
    Finally, a bit of environmental sanity from California: California Energy Commission says no to desert solar plant that could kill birds Do ...
  • New paper finds glaciers have been melting naturally at the same rate since 1850, no acceleration predicted
    A paper published today in The Cryosphere finds global glaciers melted at the same rate in the first half of the 20th century as in the sec...
  • Ship of fools finally rescued by irony
    Carbon to the Rescue Fossil fuels power retrieval of trapped climate scientists. WSJ.COM 1/2/13: Reporting on the environmental movement has...
  • Cold fact: More record lows than highs in the USA in 2013
    Cold fact: More record lows than highs in the USA in 2013 By Doyle Rice, @USATODAYWeather, USA TODAY Posted 1/2/2014 12:00:03 AM Miley Cyrus...
  • Executive Summary of the NIPCC Climate Change Reconsidered II Report
    Executive Summary from the NIPCC Climate Change Reconsidered II Report, released 9/16/13: Executive Summary  This report is produced by the ...

Blog Archive

  • ▼  2014 (20)
    • ▼  January (20)
      • Record cold from global warming causing 'polar vor...
      • New paper finds glaciers have been melting natural...
      • Paper finds solar amplification mechanism via clou...
      • Game Over! IPCC Quietly Concedes Defeat
      • Gavin's worry about the state of understanding of ...
      • Renowned physicist Freeman Dyson: Global warming i...
      • UK Climate Commission submission: IPCC AR5 Report ...
      • Paper: Scientists on ice are media's nightmare
      • Bravo! Global carbon markets' value dropped 38% in...
      • Global warming believers are today's climate deniers
      • Fossil Fuels to the Rescue in Antarctica
      • Antarctic ice shelf melt 'lowest ever recorded, gl...
      • The Alps defy global warming - but no one wants to...
      • WSJ: 'We long for the days when the weather wasn't...
      • New research shows Greenland is melting naturally ...
      • 5 million Scottish trees felled for wind farms, no...
      • California Energy Commission says no to desert sol...
      • Cold fact: More record lows than highs in the USA ...
      • 71 new papers reported in 2013 demonstrating the S...
      • Ship of fools finally rescued by irony
  • ►  2013 (480)
    • ►  December (77)
    • ►  November (64)
    • ►  October (65)
    • ►  September (130)
    • ►  August (108)
    • ►  July (36)
Powered by Blogger.

About Me

Unknown
View my complete profile