Express Global

  • Subscribe to our RSS feed.
  • Twitter
  • StumbleUpon
  • Reddit
  • Facebook
  • Digg

Thursday, 1 August 2013

New paper finds climate sensitivity to CO2 is 73% less than claimed by IPCC

Posted on 10:35 by Unknown
A new peer-reviewed paper published in Gondwana Research finds from paleoclimate proxies that climate sensitivity is only 0.8°C for a doubling of CO2 concentration from 280 to 560 ppm, 73% less than claimed by the IPCC. The paper adds to many other peer-reviewed papers finding the IPCC estimates of CO2 climate sensitivity are greatly exaggerated. 


The paper is summarized by the Swedish climate site The Stockholm Initiative [Google translation from Swedish + light editing]:
Climate sensitivity 0.8 ° C for a doubling of CO2


07/18/2013 by Ingemar Nordin .


Guest Post from Larry Huldén :


Summary: 

In a new review article in July by Gregory Retallack presents for the first time empirical paleoproxy results for mean temperature change at a doubling of CO2 concentration from 280 to 560 ppm. Climate sensitivity for a doubling of CO2 concentration was 0.8 ° C, which is significantly lower than previous estimates.


No cost, but the abstract is available. I reproduce here some key elements and conclusions of the article, which is available electronically to employees at the University of Helsinki. 


The methodology is based on 19 carefully dated and analyzed the CO2 peaks at the transition between Perm and Triassic (300-200 one million years before present) from 51 non-marine lime and kolavlagragingar from around the world. It has been compared klyvöppningsindexet in leaves of the ancient ginkgo tree in two different ways. Partly by experiments under greenhouse conditions and partly with herbarie-specimens from various post-industrial times with known CO2 concentrations in the atmosphere. The index is low at high CO2 concentration and high at low CO2 content. Fossil Ginkgo is also known from the Late Triassic and klyvöppningsindexet can be used as a reference to jump to Perm. Fröormbunken Lepidopteris were both during Perm and Trias and it had a similar profile in klyvöppningsindex with Ginkgo during late Trias. Analogous to Ginkgo has klyvöppningsindexet in fossil Lepidopteris leaf from Perm early Triassic calculated from different deposits of varying CO2 concentration. 


Temperature Variations during Perm-Trias was calculated in different ways depending on the latitude. I will not go into the methods here, but notes that such Utah New Mexico showed annual average temperatures between 24 and 37 ° C. CO2 concentration in the Perm early Trias has varied between 1000 and 7800 ppm, and in the late Triassic between 300 and 500 ppm.


The conclusions stated that CO2 temperature sensitivity corresponded to 0.8 ° C for a doubling of CO2 concentration. The same calculation for CO2 sensitivity precipitation (precipitation increase for CO2 doubling) was 89 mm and 128 mm for two different methods. 


Climate sensitivities are apparently trending steadily downward.


Retallack, 2013: Permian and Triassic greenhouse crises . - Gondwana Research [July issue] 24:90-103.


Permian and Triassic greenhouse crises


  • Gregory J. RetallackCorresponding author contact information, E-mail the corresponding author


  • Department of Geological Sciences, University of Oregon, Eugene, OR 97403, United States


  • http://dx.doi.org/10.1016/j.gr.2012.03.003, How to Cite or Link Using DOI


  • Permissions & Reprints


Abstract


Paleoclimatic time series from Permian and Triassic paleosols reveal transient episodes of unusually warm and wet conditions, interrupting long periods of cool and dry conditions usual for calcareous red paleosols. Some of these paleoclimatic events are known from stomatal index of fossil Lepidopteris leaves to have been episodes of elevated global atmospheric CO2. The magnitude of 19 known Permian and Triassic greenhouse crises varied considerably, and they offer new evidence for the relationship between paleoclimate and atmospheric CO2 levels. These greenhouse crises also had marked effects on global lowland vegetation, introducing frost-sensitive tropical lycopsids to high latitudes and drought-tolerant conifers to low latitude lowlands. Greenhouse events punctuate phases in plant evolution (Ottokaria–Callipteris, Plumsteadia–Rufloria, Lidgettonia–Tatarina, Pleuromeia, andDicroidium–Scytophyllum floras). Greenhouse events also punctuate the evolution of reptilian dynasties (successive pelycosaur, dinocephalian, dicynodont, rhynchosaur and dinosaur faunas) and respiratory adaptations (such as enlarged bony secondary palate). Greenhouse crises of the Late and Middle Permian were the most severe known, and suggest a role for atmospheric pollution with CH4 and CO2 in those mass extinction events, probably from thermogenic cracking of coals by intrusive feeder dikes of flood basalts. Because of formalities in boundary definition these mass extinctions are neither “end-Permian” nor “end-Guadalupian”, but upper Changhsingian and mid-Capitanian, respectively.

Read More
Posted in | No comments

Wednesday, 31 July 2013

New paper supports planetary theory of solar variation

Posted on 11:06 by Unknown
A new paper by Dr. Nicola Scafetta & Dr. Richard Willson, published in Astrophysics & Space Science, finds additional evidence supporting the planetary theory of solar variation, that gravitational effects from the planets explain solar cycles. Prior analysis has shown that planetary harmonics correlate with solar activity and subsequent climate change via a variety of solar amplification mechanisms.

Empirical evidences for a planetary modulation of total solar irradiance and the TSI signature of the 1.09-year Earth-Jupiter conjunction cycle

Nicola Scafetta, Richard C. Willson


Abstract: The time series of total solar irradiance (TSI) satellite observations since 1978 provided by ACRIM and PMOD TSI composites are studied. We find empirical evidence for planetary-induced forcing and modulation of solar activity. Power spectra and direct data pattern analysis reveal a clear signature of the 1.09-year Earth-Jupiter conjunction cycle, in particular during solar cycle 23 maximum. This appears to suggest that the Jupiter side of the Sun is slightly brighter during solar maxima. The effect is observed when the Earth crosses the Sun-Jupiter conjunction line every 1.09 years. Multiple spectral peaks are observed in the TSI records that are coherent with known planetary harmonics such as the spring, orbital and synodic periods among Mercury, Venus, Earth and Jupiter: the Mercury-Venus spring-tidal cycle (0.20 year); the Mercury orbital cycle (0.24 year); the Venus-Jupiter spring-tidal cycle (0.32 year); the Venus-Mercury synodic cycle (0.40 year); the Venus-Jupiter synodic cycle (0.65 year); and the Venus-Earth spring tidal cycle (0.80 year). Strong evidence is also found for a 0.5-year TSI cycle that could be driven by the Earth’s crossing the solar equatorial plane twice a year and may indicate a latitudinal solar-luminosity asymmetry. Because both spring and synodic planetary cycles appear to be present and the amplitudes of their TSI signatures appear enhanced during sunspot cycle maxima, we conjecture that on annual and sub-annual scales both gravitational and electro-magnetic planet-sun interactions and internal non-linear feedbacks may be modulating solar activity. Gravitational tidal forces should mostly stress spring cycles while electro-magnetic forces could be linked to the solar wobbling dynamics, and would mostly stress the synodic cycles. The observed statistical coherence between the TSI records and the planetary harmonics is confirmed by three alternative tests.


Related: Analysis finds the Sun explains climate change, not CO2


Read More
Posted in | No comments

New paper finds N. Atlantic ocean heat content & sea levels controlled by the natural Atlantic Multidecadal Oscillation [AMO]

Posted on 10:16 by Unknown
A paper published today in the Journal of Geophysical Research Oceans finds ocean heat content and sea levels in the Northern North Atlantic are associated with the cycles of the natural Atlantic Multidecadal Oscillation [AMO, also referred to as AMV]. The authors find the warming evident in sea levels and ocean heat content in the N. Atlantic during the satellite era [since 1979] "represents transition of the AMV from cold to warm phase" and note "an abrupt change 2009–2010 [in N. Atlantic sea levels] reaching a new minimum in 2010." 


The AMO, also sometimes referred to as Atlantic Multidecadal Variability [AMV], is an approximate ~70 year natural climate cycle that is highly correlated to Northern hemisphere and global temperature change.  Increases in greenhouse gases cannot possibly explain these shifts in ocean heat content and sea levels in the N. Atlantic. 


Northern North Atlantic sea surface height and ocean heat content variability

Sirpa Häkkinen, Peter B. Rhines, Denise L. Worthen


Abstract: The evolution of nearly 20 years of altimetric sea surface height (SSH) is investigated to understand its association with decadal to multidecadal variability of the North Atlantic heat content. Altimetric SSH is dominated by an increase of about 14 cm in the Labrador and Irminger seas from 1993 to 2011, while the opposite has occurred over the Gulf Stream region over the same time period. During the altimeter period the observed 0–700 m ocean heat content (OHC) in the subpolar gyre mirrors the increased SSH by its dominantly positive trend. Over a longer period, 1955–2011, fluctuations in the subpolar OHC reflect Atlantic multidecadal variability (AMV) and can be attributed to advection driven by the wind stress “gyre mode” bringing more subtropical waters into the subpolar gyre. The extended subpolar warming evident in SSH and OHC during the altimeter period represents transition of the AMV from cold to warm phase. In addition to the dominant trend, the first empirical orthogonal function SSH time series shows an abrupt change 2009–2010 reaching a new minimum in 2010. The change coincides with the change in the meridional overturning circulation at 26.5°N as observed by the RAPID (Rapid Climate Change) project, and with extreme behavior of the wind stress gyre mode and of atmospheric blocking. While the general relationship between northern warming and Atlantic meridional overturning circulation (AMOC) volume transport remains undetermined, the meridional heat and salt transport carried by AMOC's arteries are rich with decade-to-century timescale variability.


Read More
Posted in | No comments

New papers call into question the global sea surface temperature record

Posted on 09:26 by Unknown
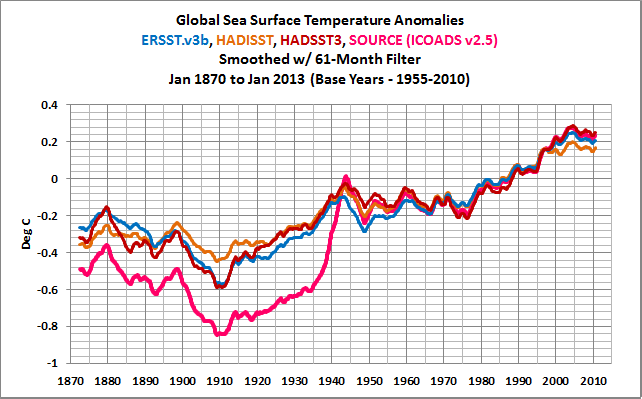
Two new companion papers published in Ocean Science call into question the data and methods used to construct global sea surface temperature records of the past 150 years. The authors find that measurements taken from ship engine cooling intakes can be "overly-warm by greater than 0.5°C on some vessels," which by way of comparison is about the same magnitude as the alleged global sea surface temperature warming since 1870. 


Furthermore, the authors "report the presence of strong near-surface temperature gradients day and night, indicating that intake and bucket measurements cannot be assumed equivalent in this region. We thus suggest bucket and buoy measurements be considered distinct from intake measurements due to differences in sampling depth. As such, we argue for exclusion of intake temperatures from historical SST datasets and suggest this would likely reduce the need for poorly field-tested bucket adjustments. We also call for improvement in the general quality of intake temperatures from Voluntary Observing Ships... We suggest that reliable correction for such warm errors is not possible since they are largely of unknown origin and can be offset by real near-surface temperature gradients."


Data sets combining ship intake and bucket measurements show ~0.5C warming since 1870, but this new paper argues that the two types of measurement are from different sampling depths and should not be combined. Graph source: Bob Tisdale via WUWT

For more on the ship intake vs. buckets issue and the questionable adjustments involved, see these posts at WUWT & links to Climate Audit:


Historical Sea Surface Temperature Adjustments/Corrections aka “The Bucket Model”…


Buckets, Inlets, SST’s and all that – part 1


Resolving the biases in century-scale sea surface temperature measurements reveals some interesting patterns


Full papers available here:


Comparing historical and modern methods of sea surface temperature measurement – Part 1: Review of methods, field comparisons and dataset adjustments

J. B. R. Matthews
School of Earth and Ocean Sciences, University of Victoria, Victoria, BC, Canada
Abstract. Sea surface temperature (SST) has been obtained from a variety of different platforms, instruments and depths over the past 150 yr. Modern-day platforms include ships, moored and drifting buoys and satellites. Shipboard methods include temperature measurement of seawater sampled by bucket and flowing through engine cooling water intakes. Here I review SST measurement methods, studies analysing shipboard methods by field or lab experiment and adjustments applied to historical SST datasets to account for variable methods. In general, bucket temperatures have been found to average a few tenths of a °C cooler than simultaneous engine intake temperatures. Field and lab experiments demonstrate that cooling of bucket samples prior to measurement provides a plausible explanation for negative average bucket-intake differences. These can also be credibly attributed to systematic errors in intake temperatures, which have been found to average overly-warm by >0.5 °C on some vessels. However, the precise origin of non-zero average bucket-intake differences reported in field studies is often unclear, given that additional temperatures to those from the buckets and intakes have rarely been obtained. Supplementary accurate in situ temperatures are required to reveal individual errors in bucket and intake temperatures, and the role of near-surface temperature gradients. There is a need for further field experiments of the type reported in Part 2 to address this and other limitations of previous studies.


Comparing historical and modern methods of sea surface temperature measurement – Part 2: Field comparison in the central tropical Pacific

J. B. R. Matthews1 and J. B. Matthews2
1School of Earth and Ocean Sciences, University of Victoria, Victoria, BC, Canada
2Dr. J. B. Matthews Consulting, Tennis Road, Douglas, Isle of Man, British Isles

Abstract. Discrepancies between historical sea surface temperature (SST) datasets have been partly ascribed to use of different adjustments to account for variable measurement methods. Until recently, adjustments had only been applied to bucket temperatures from the late 19th and early 20th centuries, with the aim of correcting their supposed coolness relative to engine cooling water intake temperatures. In the UK Met Office Hadley Centre SST 3 dataset (HadSST3), adjustments have been applied over its full duration to observations from buckets, buoys and engine intakes. Here we investigate uncertainties in the accuracy of such adjustments by direct field comparison of historical and modern methods of shipboard SST measurement. We compare wood, canvas and rubber bucket temperatures to 3 m seawater intake temperature along a central tropical Pacific transect conducted in May and June 2008. We find no average difference between the temperatures obtained with the different bucket types in our short measurement period (∼1 min). Previous field, lab and model experiments have found sizeable temperature change of seawater samples in buckets of smaller volume under longer exposure times. We do, however, report the presence of strong near-surface temperature gradients day and night, indicating that intake and bucket measurements cannot be assumed equivalent in this region. We thus suggest bucket and buoy measurements be considered distinct from intake measurements due to differences in sampling depth. As such, we argue for exclusion of intake temperatures from historical SST datasets and suggest this would likely reduce the need for poorly field-tested bucket adjustments. We also call for improvement in the general quality of intake temperatures from Voluntary Observing Ships. Using a physical model we demonstrate that warming of intake seawater by hot engine room air is an unlikely cause of overly warm intake temperatures. We suggest that reliable correction for such warm errors is not possible since they are largely of unknown origin and can be offset by real near-surface temperature gradients.

Read More
Posted in | No comments

Monday, 29 July 2013

The EPA's secret 'settled science'

Posted on 16:47 by Unknown
The EPA's Game of Secret Science


The agency pursues rules that will cost billions but refuses to reveal its research. Maybe a subpoena will be needed.


By LAMAR SMITH


WSJ.COM 7/29/13: As the Environmental Protection Agency moves forward with some of the most costly regulations in history, there needs to be greater transparency about the claimed benefits from these actions. Unfortunately, President Obama and the EPA have been unwilling to reveal to the American people the data they use to justify their multibillion-dollar regulatory agenda.


To cite a few examples of where the EPA would like to take the country, the agency is moving forward with strict new limits on ozone that by its own estimates will cost taxpayers $90 billion per year, which would make the regulation the most costly in history. Other examples include a Mercury and Air Toxics Standard for power plants (previously known as "Utility MACT") that the EPA estimates could cost up to $10 billion a year. Yet more than 99% of the EPA's health-based justifications for the rule are derived from scientific research that the EPA won't reveal. Taxpayers are supposed to take on faith that EPA policy is backed by good science.


We know this much: Virtually every major EPA air-quality regulation under President Obama has been justified by citing two sets of decades-old data from the Harvard Six Cities Study and the American Cancer Society's Cancer Prevention Study II. The EPA uses the data to establish an association between fine-particulate emissions and mortality.


image


image


Associated Press


Gina McCarthy


For two years, the House Science, Space and Technology Committee, of which I am the chairman, has sought to make this information available to the public. But the EPA has obstructed the committee's request at every step. To date, the committee has sent six letters to the EPA and other top administration officials seeking the data's release.


In September 2011, the EPA's then-Assistant Administrator Gina McCarthy committed to provide these data sets to the committee. But the data still remain out of sight. Ms. McCarthy was recently confirmed by the Senate as administrator of the EPA. Now that she leads the agency, Ms. McCarthy has no excuse not to make these taxpayer-funded studies public.


Simple transparency is not the only reason this information should be released. The costs of these rules will be borne by American families. They deserve to know what they are paying for. Time is almost up. If the administration does not provide this data by the end of July, the science committee will force its release through a subpoena.


The federal government has no business justifying regulations with secret information. This principle has been supported by two of the president's own science and technology advisers, John Holdren and Deborah Swackhamer. "The data on which regulatory decisions and other decisions are based should be made available to the committee and should be made public," said Dr. Holdren in testimony before the committee last year. Executive-branch rules dating to the Clinton administration require that federally funded research data be made publicly available, especially if it is used for regulatory purposes.


The data in question have not been subjected to scrutiny and analysis by independent scientists. And the EPA does not subject its cost-benefit claims to peer review. This means we have no way of evaluating the quality of the science being used to justify the agency's claims.


The withholding of information is troubling—and not just because it is being done by "the most transparent administration in history," as the president boasted in February. The National Academy of Sciences declared in 2004 that the data the EPA is using is of "little use for decision-making." Similarly, President Obama's Office of Management and Budget recently acknowledged that "significant uncertainty remains" about the EPA's claims based on its data sets, saying that the claims "may be misleading" and should be treated with caution.


Yet the EPA presses on: The same data are used to justify the agency's claims about the health benefits of recent proposals to limit emissions for refineries and vehicles. The agency is also poised to use the data to justify its expensive new ozone standards—the EPA's Regulatory Impact Analysis estimated that lowering the ozone standard to 60-70 parts per billion would cost up to $90 billion per year in compliance costs. The regulation could force large areas of the country into non-attainment, a designation that would drastically limit economic growth. Inevitably, the costs would be borne by working families and would include higher gasoline and electricity prices.


The administration's reliance on secret science doesn't stop there. President Obama's ambitious and costly new climate agenda is backed by a finding from a federal interagency working group regarding the "social cost of carbon." How that "social cost" was determined remains unclear. This new justification for economy-wide regulations was developed without public comment or peer review.


The U.S. saw dramatic improvements in air quality well before the Obama administration came to Washington, yet the White House has upped the ante, launching an aggressive anti-fossil-fuel, regulatory assault on affordable energy—while refusing to reveal the scientific basis for the campaign. The EPA should reveal the research it uses and let the American people decide whether the agency's costly regulations are justified.


Rep. Lamar Smith represents the 21st District of Texas and is chairman of the House Committee on Science, Space and Technology.


Read More
Posted in | No comments

New paper finds climate change over decades primarily determined by the oceans

Posted on 15:50 by Unknown

A new paper published in Nature finds climate change over timescales longer than 10 years is "primarily determined by the ocean," which skeptics, including famed Professor Emeritus of Atmospheric Science Dr. William Gray, have been saying for years. According to the paper, "the ocean significantly affects long term climate fluctuations, while the seemingly chaotic atmosphere is mainly responsible for the shorter-term, year-to-year changes." 


According to the authors, "Our findings suggest that the predictability of mid-latitude North Atlantic air–sea interaction could extend beyond the ocean to the climate of surrounding continents," corroborating the many papers which have demonstrated that ocean oscillations control land-based climate as well. Ocean oscillations, in turn, have been correlated to solar activity. 


North Atlantic region, dark blue area was used for temperature data, red area for the heat flux. (Credit: C. Kersten, GEOMAR)


Deciphering the Air-Sea Communication: Ocean Significantly Affects Long-Term Climate Fluctuations


July 25, 2013 — Why does hurricane activity vary from decade to decade? Or rainfall in the Sahel region? And why are the trans-Atlantic changes frequently in sync? A German-Russian research team has investigated the role of heat exchange between ocean and atmosphere in long-term climate variability in the Atlantic. The scientists analyzed meteorological measurements and sea surface temperatures over the past 130 years. It was found that the ocean significantly affects long term climate fluctuations, while the seemingly chaotic atmosphere is mainly responsible for the shorter-term, year-to-year changes.


The study appears in the current issue of the journal Nature, and provides important information on the predictability of long-term climate fluctuations.

How do the ocean and atmosphere communicate? What information do they exchange, and what are the results? These are questions that climate scientists must ask, especially if they want to understand the cause of natural climate fluctuations of varying duration. These fluctuations superimpose the general global warming trend since the beginning of industrialization and thus complicate the accurate determination of human influence on the climate. The causes and mechanisms of natural climate variability, however, are poorly understood. A study led by scientists at the GEOMAR Helmholtz Centre for Ocean Research Kiel shows that the ocean currents influence the heat exchange between ocean and atmosphere and thus can explain climate variability on decadal time scales.

The presumption of such predictability potential has been around for more than half a century. In 1964, the Norwegian climate researcher Jacob Bjerknes postulated different causes of climate variability on different time scales. While the atmosphere is mainly causing climate variations on shorter time scales, from months to years, the longer-term fluctuations, such as those on decadal time scales, are primarily determined by the ocean. The first part of this hypothesis has been well studied by now, but the second part still required some verification. "In the current study, we can utilize a new analysis of shipboard measurements, taken since the end of the 19th century, to verify the second part of the Bjerknes hypothesis," says Prof. Mojib Latif of GEOMAR, co-author of the study. "In particular, for the long-term climate variability in the Atlantic sector, the Gulf Stream circulation is of vital importance," said Latif.

Ocean currents affect the surface temperature of the oceans and thus the heat exchange with the atmosphere -- eventually causing climate variations on the adjacent continents. The most evident is an oscillation with a period of 60 years. "Such decadal climate fluctuations are superimposed on the general warming trend, so that at times it seems as if the warming trend slowed or even stopped. After a few decades, it accelerates once again," explains Prof. Latif. "It is important for us to understand these natural cycles, so that we can finally provide better climate predictions as well." One of the major problems, as Latif explained, is that there are just very few long-term oceanic measurements, thereby complicating the analysis and interpretation of climate change signals. Therefore, scientists are using increasingly refined statistical methods to extract more and more information from the available data sets.

"We need both, realistic model simulations and long-term data records, and really sophisticated analysis methods to produce reliable climate predictions. Our work is an additional piece in the giant puzzle of global climate variability, but I am confident that we will be able to extract the secrets underlying the natural climate fluctuations," says Prof. Latif.

Journal Reference:


North Atlantic Ocean control on surface heat flux on multidecadal timescales


  • Sergey K. Gulev,

  • Mojib Latif,

  • Noel Keenlyside,

  • Wonsun Park

  • & Klaus Peter Koltermann


    Nature 499,  464–467 (25 July 2013)  doi:10.1038/nature12268

Nearly 50 years ago Bjerknes1 suggested that the character of large-scale air–sea interaction over the mid-latitude North Atlantic Ocean differs with timescales: the atmosphere was thought to drive directly most short-term—interannual—sea surface temperature (SST) variability, and the ocean to contribute significantly to long-term—multidecadal—SST and potentially atmospheric variability. Although the conjecture for short timescales is well accepted, understanding Atlantic multidecadal variability (AMV) of SST2, 3 remains a challenge as a result of limited ocean observations. AMV [Atlantic multidecadal variability]  is nonetheless of major socio-economic importance because it is linked to important climate phenomena such as Atlantic hurricane activity and Sahel rainfall, and it hinders the detection of anthropogenic signals in the North Atlantic sector4, 5, 6. Direct evidence of the oceanic influence of AMV can only be provided by surface heat fluxes, the language of ocean–atmosphere communication. Here we provide observational evidence that in the mid-latitude North Atlantic and on timescales longer than 10  years, surface turbulent heat fluxes are indeed driven by the ocean and may force the atmosphere, whereas on shorter timescales the converse is true, thereby confirming the Bjerknes conjecture. This result, although strongest in boreal winter, is found in all seasons. Our findings suggest that the predictability of mid-latitude North Atlantic air–sea interaction could extend beyond the ocean to the climate of surrounding continents.


Related:


Posts on ocean oscillations

Why Trenberth is wrong about 'missing heat' in the deep ocean


California Climate change is caused by the Pacific Decadal Oscillation Not by Carbon Dioxide


Central England temperature changes over past 350 years controlled by the Atlantic Multidecadal Oscillation


New paper finds tiny changes in solar activity affect ENSO & East Asian climate change


A simple climate model of ocean oscillations and sunspot integral outperforms GCMs


RealClimate admits doubling CO2 could only heat the oceans 0.002ºC at most


Read More
Posted in | No comments

Friday, 26 July 2013

New paper finds the same climate model produces different results when run on different computers

Posted on 19:54 by Unknown
As if climate models didn't already have enough problems, a paper published today in the Monthly Weather Review finds that the same climate model run on different computer hardware and operating systems produces different results, "primarily due to the treatment of rounding errors by the different software systems" and that these errors propagate over time. According to the authors, "The [hardware & software] system dependency, which is the standard deviation of the 500-hPa geopotential height [areas of high & low pressure] averaged over the globe, increases with time." The authors find, "the ensemble spread due to the differences in software system is comparable to the ensemble spread due to the differences in initial conditions that is used for the traditional ensemble forecasting." The initial conditions of climate models have already been shown by many papers to produce significantly different projections of climate. 


Could climate catastrophe be due to a rounding error?


Monthly Weather Review 2013 ; e-View


doi: http://dx.doi.org/10.1175/MWR-D-12-00352.1


An Evaluation of the Software System Dependency of a Global Atmospheric Model


Song-You Hong,1 Myung-Seo Koo,1 Jihyeon Jang,1 Jung-Eun Esther Kim,2 Hoon Park,1,3 Min-Su Joh,4 Ji-Hoon Kang,4 and Tae-Jin Oh5


1 Department of Atmospheric Sciences, Yonsei University, Seoul, Korea


2 National Oceanic and Atmospheric Administration (NOAA)/Earth System Research Laboratory (ESRL), Boulder, Colorado, USA


3 Numerical Weather Prediction center, Korea Meteorological Administration, Seoul, Korea


4 Supercomputer Center, Korea Institute of Science and Technology Information, Daejeon, Korea


5 Korea Institute of Atmospheric Prediction Systems, Seoul, Korea


Abstract


This study presents the dependency of the simulation results from a global atmospheric numerical model on machines with different hardware and software systems. The global model program (GMP) of the Global/Regional Integrated Model system (GRIMs) is tested on 10 different computer systems having different central processing unit (CPU) architectures or compilers. There exist differences in the results for different compilers, parallel libraries, and optimization levels, primarily due to the treatment of rounding errors by the different software systems. The system dependency, which is the standard deviation of the 500-hPa geopotential height averaged over the globe, increases with time. However, its fractional tendency, which is the change of the standard deviation relative to the value itself, remains nearly zero with time. In a seasonal prediction framework, the ensemble spread due to the differences in software system is comparable to the ensemble spread due to the differences in initial conditions that is used for the traditional ensemble forecasting.


Read More
Posted in | No comments
Newer Posts Older Posts Home
Subscribe to: Posts (Atom)

Popular Posts

  • The green dream is not compatible with billions of the poor in search of higher living standards
    A Common Fallacy in the Energy and Climate Debate By [warmist] Schalk Cloete, The Energy Collective, 9/10/13 The vast majority of the energy...
  • UK Climate Commission submission: IPCC AR5 Report 'definitely weakens the case for action' on climate
    A submission to the UK Energy and Climate Change Committee inquiry into the IPCC AR5 Report points out how the IPCC has deliberately obscure...
  • Gavin's worry about the state of understanding of climate science comes true
    From a comment at WUWT: DB   says: December 28, 2013 at 5:34 pm Jimbo wrote: “Wasn’t Gavin for a specified period of no global surface warmi...
  • Special Report: The Age of Plenty debunks alarmist claims of food shortages
    Paging Paul Ehrlich :  IEEE Spectrum , the journal of the world's largest professional association for the advancement of technology, ha...
  • Paper: Scientists on ice are media's nightmare
    EDITORIAL: Scientists on ice are media's nightmare The Gazette editorial •  Updated: January 4, 2014 at 8:28 am  • Published: January 4,...
  • California Energy Commission says no to desert solar plant that could kill birds
    Finally, a bit of environmental sanity from California: California Energy Commission says no to desert solar plant that could kill birds Do ...
  • New paper finds glaciers have been melting naturally at the same rate since 1850, no acceleration predicted
    A paper published today in The Cryosphere finds global glaciers melted at the same rate in the first half of the 20th century as in the sec...
  • Ship of fools finally rescued by irony
    Carbon to the Rescue Fossil fuels power retrieval of trapped climate scientists. WSJ.COM 1/2/13: Reporting on the environmental movement has...
  • Cold fact: More record lows than highs in the USA in 2013
    Cold fact: More record lows than highs in the USA in 2013 By Doyle Rice, @USATODAYWeather, USA TODAY Posted 1/2/2014 12:00:03 AM Miley Cyrus...
  • Executive Summary of the NIPCC Climate Change Reconsidered II Report
    Executive Summary from the NIPCC Climate Change Reconsidered II Report, released 9/16/13: Executive Summary  This report is produced by the ...

Blog Archive

  • ▼  2014 (20)
    • ▼  January (20)
      • Record cold from global warming causing 'polar vor...
      • New paper finds glaciers have been melting natural...
      • Paper finds solar amplification mechanism via clou...
      • Game Over! IPCC Quietly Concedes Defeat
      • Gavin's worry about the state of understanding of ...
      • Renowned physicist Freeman Dyson: Global warming i...
      • UK Climate Commission submission: IPCC AR5 Report ...
      • Paper: Scientists on ice are media's nightmare
      • Bravo! Global carbon markets' value dropped 38% in...
      • Global warming believers are today's climate deniers
      • Fossil Fuels to the Rescue in Antarctica
      • Antarctic ice shelf melt 'lowest ever recorded, gl...
      • The Alps defy global warming - but no one wants to...
      • WSJ: 'We long for the days when the weather wasn't...
      • New research shows Greenland is melting naturally ...
      • 5 million Scottish trees felled for wind farms, no...
      • California Energy Commission says no to desert sol...
      • Cold fact: More record lows than highs in the USA ...
      • 71 new papers reported in 2013 demonstrating the S...
      • Ship of fools finally rescued by irony
  • ►  2013 (480)
    • ►  December (77)
    • ►  November (64)
    • ►  October (65)
    • ►  September (130)
    • ►  August (108)
    • ►  July (36)
Powered by Blogger.

About Me

Unknown
View my complete profile